
Commercial Vehicles: Trucks & Buses AI Visibility & GEO Readiness Report
About the Commercial Vehicles: Trucks & Buses AI Visibility & GEO Readiness Report
The Commercial Vehicles: Trucks & Buses AI Visibility & GEO Readiness Report benchmarks how truck, bus, and fleet-vehicle brands in India are discovered, mentioned, compared and recommended across leading AI search and answer engines. Findings are drawn from an analysis of 1.75 million AI answers collected over 7 days, in response to category-specific, use-case and intent-driven queries measuring AI visibility, share of voice, recommendation quality, consistency, citation authority and owned-source influence. This is one report in GoVISIBLE's AI Visibility Index India 2026.What Does This Report Measure?
This report captures how AI engines respond to use-case and intent-driven prompts within Commercial Vehicles: Trucks & Buses, such as “best truck brand for long-haul fleet operations in India” or “which bus manufacturer offers the most reliable after-sales service.” It is not a generic brand-awareness or market-share ranking. A brand's AI Readiness standing here can legitimately differ from how it would rank on a broad prompt like “top commercial vehicle brands in India,” because the prompt universe and the behaviors being measured are different.Who Is This Report For?
This report is written for marketing leaders, SEO, GEO, content and digital managers, and specialists who need to understand how their brand and competitors appear and get recommended across AI search and answer platforms. It is equally relevant to agencies pitching GEO services, PR and comms teams looking for defensible data points, and fleet or B2B sales leaders who want to understand how AI shapes commercial-vehicle purchase research.Glossary quick-reference
| Term | In one line |
|---|---|
| Mention % | Share of tracked AI answers in which the brand appeared at all. |
| Share of Voice % | Brand's mentions as a share of all brand mentions in the category. |
| GEO Quality % | How favorably and forcefully AI talks about the brand once it appears. |
| Engine Favorability % | The same tone measure, applied to an AI engine rather than a brand. |
| Consistency % | How reliably a brand or engine repeats run after run. |
How AI-Ready Is the Commercial Vehicles: Trucks & Buses Market?
Start with the headline numbers, because they set up the tension the rest of this report unpacks: the brand AI surfaces most is not the brand AI trusts most.Which Commercial Vehicles: Trucks & Buses Brands Lead AI Visibility and Recommendation Quality?
Tata Motors leads on share of voice at 20.3%, well clear of Ashok Leyland at 13.2%, a 7.1pp gap. But Freightliner leads on trust, with a 79.2% GEO Quality score against Tata Motors' own 48.6%, a 30.6pp gap between the category's most visible brand and its most positively represented one. Visibility and endorsement are not the same game in this category.

AI Visibility vs Recommendation Quality: Where Do Brands Stand in Commercial Vehicles: Trucks & Buses?
Plotting reach against trust makes the category's central tension visible at a glance. No brand sits convincingly in both the high-mention and high-quality space at once: the closest is Volvo, with solid numbers on both axes but a genuine leader on neither.
Full quadrant membership (tracked brand set)
Leaders: Eicher, BharatBenz, Mahindra, Volvo, Scania, Switch Mobility, Freightliner, Toyota Niche Quality: Mercedes-Benz, Kenworth, Chevrolet, Euler Motors, GM, Peterbilt High Noise: Tata Motors, Ashok Leyland, Ford, Isuzu, Olectra Greentech, Caterpillar Laggards: JBM Auto, SML Isuzu, Komatsu, EKA Mobility, Maruti Suzuki, Ram Trucks, BYD, MAN Truck & BusHow Concentrated Is AI Visibility in the Commercial Vehicles: Trucks & Buses Market?
The top 5 brands control 59.3% of total AI visibility in this category, leaving 40.7% spread across the remaining tracked brands. That is a moderately concentrated market: incumbents have a real head start, but four in ten mentions still go to brands outside the top 5, which keeps the door open for a well-executed challenger play.
Which AI Engines Matter Most for Commercial Vehicles: Trucks & Buses Brand Visibility?
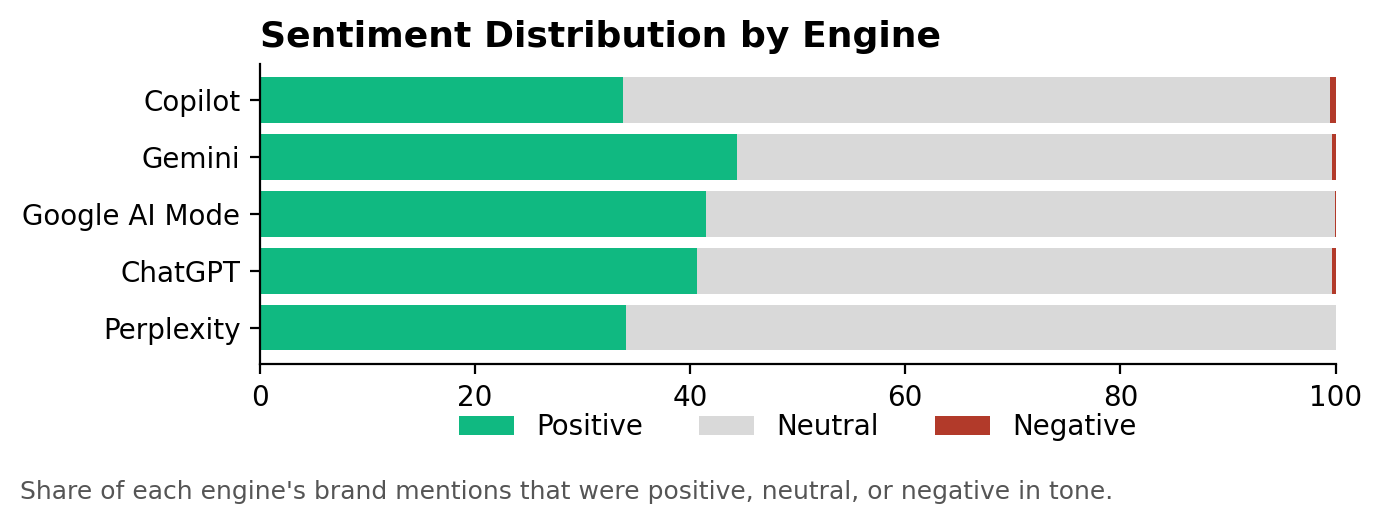
Copilot is the most frequently surfaced engine in this category's tracked conversations, at 24.9% mention share, narrowly ahead of Gemini at 24.8%. But Gemini is the more generous engine once it does recommend a brand, with 44.4% positive sentiment against Copilot's 33.8%.
Which AI Engines Show the Most Consistent Brand Recommendations?
Copilot currently provides the most stable visibility signal in this dataset, at 88.8% engine consistency, meaning its brand rankings repeat reliably run after run. Perplexity is second at 83.4%. ChatGPT is the least consistent of the five at 70.1%, so a strong showing there is less likely to hold on a repeat query than the same result on Copilot.

Which brand each engine currently favors
| Engine | #1 brand | #2 brand | #3 brand |
|---|---|---|---|
| ChatGPT | Tata Motors (21.5%) | Ashok Leyland (14.5%) | BharatBenz (12.0%) |
| Copilot | Tata Motors (22.2%) | Ashok Leyland (16.1%) | Mahindra (10.4%) |
| Gemini | Tata Motors (17.6%) | Ashok Leyland (11.0%) | Eicher (9.2%) |
| Google AI Mode | Tata Motors (23.9%) | Ashok Leyland (13.3%) | Eicher (12.7%) |
| Perplexity | Tata Motors (15.0%) | Ashok Leyland (9.6%) | Volvo (9.6%) |
How Consistent Are AI Brand Recommendations in Commercial Vehicles: Trucks & Buses?
Ashok Leyland, Eicher and Tata Motors don't just appear once. Each shows up in 100% of tracked runs with perfect retention and rank stability, making them the most dependable presences in AI answers for this category. Volvo, BharatBenz and Mahindra are close behind, all above 98% Brand Consistency.
Which Brands Win Across Different Buyer Intents and Journeys?
Tata Motors wins every journey stage and both tracked intents in this dataset, but not by the same margin throughout. Its Decision-stage quality (71.1%) is far stronger than its Awareness-stage quality (24.3%), which suggests its AI presence sharpens rather than fades as a buyer moves closer to purchase.
Journey and intent winners
| Journey / Intent | Winning brand | Quality % |
|---|---|---|
| Awareness | Tata Motors | 24.3% |
| Consideration | Tata Motors | 45.0% |
| Decision | Tata Motors | 71.1% |
| Commercial intent | Tata Motors | 59.9% |
| Informational intent | Tata Motors | 29.4% |
Which brand wins each persona cluster
| Cluster | Winning brand | Mention share % | Quality % |
|---|---|---|---|
| Booking & Service Platforms | Volvo | 63.6% | 21.4% |
| Route & Travel Experience | Volvo | 51.5% | 63.2% |
| Price & Ownership Costs | Tata Motors | 24.5% | 39.1% |
| Electric & Future Trends | Tata Motors | 21.7% | 43.9% |
| Commercial Use & Business | Tata Motors | 20.8% | 59.0% |
| Vehicle Types & Specifications | Tata Motors | 17.9% | 57.8% |
Where Is the Biggest AI Visibility Opportunity in Commercial Vehicles: Trucks & Buses?
Euler Motors already earns AI's trust at 63.8% quality without spending on reach (0.7% SOV); the fastest lever here is visibility, not credibility. It leads a small group of Hidden Gems that have solved the harder half of the AI-visibility problem and are simply not being asked about often enough.
This view uses a broader brand pool than the Brand Readiness Quadrant in Section 3, so quadrant cutoffs differ — a brand's SOV/Quality values are consistent across both charts, but its quadrant placement may not be.
Hidden Gems brands show the strongest trust signal in the category at 66.2% average GEO Quality, while Reach Risk brands control the highest visibility share within the top-brand pool, at 43.5%. That is the opportunity in one comparison: the brands AI already trusts most are not the brands it talks about most. Tata Motors and Ashok Leyland anchor Reach Risk, both commanding double-digit SOV while trailing on quality (48.6% and 43.9%). For a challenger brand, GEO Leaders — Eicher, Mahindra and BharatBenz — show that reach and trust can coexist in this category; the gap is not structural, it's a spend-and-content gap.Which Sources Do AI Engines Trust When Recommending Commercial Vehicles: Trucks & Buses Brands?
Who does AI trust? Business websites supply 41.8% of what AI cites in this category, more than any other source type, followed by eCommerce and aggregator sites at 28.8%. Together those two categories account for roughly seven in ten citations, which means a brand's own website is only one part of its AI reputation; the information ecosystem around a brand matters just as much.
How Dependent Is Commercial Vehicles: Trucks & Buses on Third-Party Sources for AI Visibility?
AI discovery in this category is 94.5% dependent on third-party sources, with only 5.5% of citations tied back to a brand's own domain on average. Brands investing in their own site's AI-citability have real headroom, since almost every brand in this category is currently ceding its AI narrative to sites it doesn't control.
Engine citation load
| Engine | Avg citations / prompt | Citation share % | Third-party dependency % |
|---|---|---|---|
| ChatGPT | 16.5 | 39.6% | 91.2% |
| Perplexity | 10.0 | 23.9% | 98.6% |
| Google AI Mode | 7.3 | 17.6% | 91.6% |
| Copilot | 4.2 | 10.1% | 96.4% |
| Gemini | 3.7 | 8.8% | 92.1% |
What Should Commercial Vehicles: Trucks & Buses Brands Do About Their AI Visibility?
Who AI treats as substitutes

AI hasn't decided who owns Commercial Vehicles: Trucks & Buses yet.
The top 5 brands command just 59.3% of visibility while the strongest AI endorsement often goes to brands with the least reach, a gap that leaves this category genuinely contestable for any brand willing to invest in both reach and tone at once.Executive takeaways
The category is still contestable, not locked up.
The top 5 brands hold 59.3% of Share of Voice, a moderate concentration that leaves 40.7% of visibility spread across the remaining tracked brands.A challenger brand does not need to out-spend Tata Motors on volume to gain ground; it needs a deliberate, sustained GEO push into the remaining share.
→ Which prompts in this category is your brand currently absent from entirely?
Reach and trust are earned separately here.
Tata Motors leads Share of Voice at 20.3% but trails the GEO Quality leader, Freightliner, by 30.6 points (48.6% vs. 79.2%).Winning the visibility race does not automatically win the trust race. Brands chasing reach without a parallel quality strategy will keep showing up without being recommended.
→ If your brand doubled its AI mentions tomorrow, would the tone of those mentions actually improve?
AI's own trust economy runs through third-party sites, not brand domains.
Only 5.5% of citations in this category trace back to a brand's own website; 94.5% come from third-party sources, led by business websites (41.8%) and eCommerce/aggregator sites (28.8%).A GEO content strategy here should prioritize earning coverage on trade and aggregator sites over investing solely in owned-site content.
→ Which third-party sites currently shape how AI describes your brand, and do you have a relationship with any of them?
Engine choice changes both what AI says and how often it repeats itself.
Copilot surfaces this category most often (24.9% share) and is also the most consistent engine (88.8%), but Gemini is the more generous engine on tone (44.4% positive vs. Copilot's 33.8%).A win on Copilot is more likely to hold on a repeat query than the same win on ChatGPT, the least consistent engine at 70.1%.
→ Are you tracking engine-level differences, or treating “AI visibility” as one undifferentiated channel?
The category's biggest single opportunity is quality-first, not reach-first.
Hidden Gems brands average 66.2% GEO Quality on minimal reach, while Reach Risk brands control 43.5% of visibility within the top-brand pool despite weaker quality.Euler Motors, Chevrolet and GM have already solved the harder half of AI visibility; the fastest path to AI Readiness for a low-reach brand is amplifying an already-earned trust signal, not building one from scratch.
→ If your brand's GEO Quality already beats the category leader's reach numbers, what is stopping you from being asked about more often?
What this means
| Brand posture | Strategic label | Question to ask |
|---|---|---|
| High reach, high quality | Leaders | How do we defend both numbers as more brands enter this quadrant? |
| Low reach, high quality | Niche Quality | What is the fastest way to earn more AI mentions without diluting tone? |
| High reach, low quality | High Noise | Why does AI talk about us often but not warmly? |
| Low reach, low quality | Laggards | Is a GEO investment worthwhile here, or is this category not core to the brand? |
Frequently Asked Questions About Commercial Vehicles: Trucks & Buses AI Visibility
Which commercial vehicle brand has the highest AI visibility in India?
Tata Motors leads AI visibility in Commercial Vehicles: Trucks & Buses, with a 27.7% Mention % and 20.3% Share of Voice, the highest of any tracked brand.
Which commercial vehicle brand does AI recommend most positively?
Freightliner leads on GEO Quality among brands meeting the minimum mention threshold, at 79.2%, the most favorable tone AI applies to any brand in this category.
Which AI engine surfaces commercial vehicle brands most often?
Copilot is the most frequently surfaced engine in this category, with a 24.9% mention share, narrowly ahead of Gemini at 24.8%.
How fragmented is AI visibility in Commercial Vehicles: Trucks & Buses in India?
The top 5 brands hold 59.3% of Share of Voice, a moderately concentrated market that still leaves 40.7% of visibility open to brands outside the top 5.
What sources do AI engines cite when discussing commercial vehicle brands?
Business websites supply the largest share of citations at 41.8%, followed by eCommerce and aggregator sites at 28.8%. Social media platforms supply the smallest share, at 1.6%.
Which commercial vehicle brands are most consistently recommended by AI over time?
Ashok Leyland, Eicher and Tata Motors each show 100% Brand Consistency, appearing in every tracked run with perfect retention and rank stability.
How dependent is this category on third-party sources for AI visibility?
AI discovery in Commercial Vehicles: Trucks & Buses is 94.5% dependent on third-party sources on average, with only 5.5% of citations coming from brands' own domains.
Methodology: How the Commercial Vehicles: Trucks & Buses AI Visibility Index Was Measured
This report is based on analysis of 1.75 million AI answers, collected over 7 days, across ChatGPT, Gemini, Google AI Mode, Copilot and Perplexity, in response to use-case and intent-driven prompts specific to Commercial Vehicles: Trucks & Buses.| Metric | Method |
|---|---|
| GEO Readiness Score | 30% Visibility + 25% Quality + 20% Consistency + 15% Citation Readiness + 10% Owned Source Influence |
| Mention % | Unique brand appearances across prompt-engine-run units / total prompt-engine-run units × 100 |
| Share of Voice % | Brand mentions / total brand mentions × 100 |
| GEO Quality % | (Positive % + Strong %) / 2 |
| Engine Favorability % | Same formula as GEO Quality %, applied at the AI-engine level. Measures tone/favorability once an engine recommends a brand; it does not measure engine accuracy or reliability. |
| GEO Quality Leader | Highest GEO Quality % among brands meeting the minimum mention threshold |
| AI Authority % | Weighted composite of normalized visibility, GEO Quality, engine presence and appearance strength |
| Brand Consistency % | 45% Run Appearance + 35% Consecutive Retention + 20% Rank Stability |
| Engine Consistency % | 40% Avg Retention + 25% Avg Jaccard + 20% Core Brand Rate + 15% Rank Stability |
| Citation Source Authority | Citations from a source category / total citations × 100 |
| Owned Source Influence % | Brand own-domain citations / brand total citations × 100 (estimated via domain/brand-token matching) |
| Co-mention Association % | Answers where Brand A and Brand B appear together / answers where either appears × 100 |
| Opportunity / Readiness Quadrants | Median split on the two plotted axes; cutoff basis (full category vs. top-brand pool) stated per chart |
| Market Concentration % | Sum of Share of Voice % for the top 5 brands |
| Funnel Mention % | Brand mentions in a journey stage / all brand mentions in that journey stage × 100 |
About GoVISIBLE
GoVISIBLE is an AI Visibility Intelligence company focused on understanding how AI engines discover, evaluate and recommend brands. We study how brands appear across AI-generated answers, what sources influence those answers, and which signals shape AI recommendations. Our platform helps brands translate these emerging patterns into measurable visibility and optimization strategies. The AI Visibility Index — India 2026 is part of GoVISIBLE's ongoing research into the changing dynamics of AI-led discovery and brand visibility. GoVISIBLE — Optimizing Brands for the AI Search Era. Staying AI-visible in Commercial Vehicles: Trucks & Buses means earning trust from a small set of AI engines that fleet buyers and operators increasingly consult before talking to a salesperson. The brands that invest now, in both reach and tone, will define how this category gets recommended for years to come. Take the next step to strengthen your brand's visibility in AI answers.Free AI Visibility Audit
See exactly how your brand appears across AI engines today.- Category-specific prompt testing
- Visibility & quality benchmarking
- Actionable next steps
Hire a GEO Expert
Get hands-on help building your AI visibility strategy.- Dedicated GEO strategist
- Content & citation planning
- Ongoing performance tracking
Request a Demo
See the GoVISIBLE platform in action for your category.- Live AI visibility dashboard
- Competitor benchmarking
- Custom reporting
Agency Partner Program
Bring GEO services to your clients with GoVISIBLE's platform.- White-label reporting
- Partner enablement
- Revenue share model
GoVISIBLE — The Leader in AI Visibility. marketing@govisible.ai | govisible.ai | linkedin.com/company/govisible-ai