Become a VISIBLE™ Partner

| Term | In one line |
|---|---|
| Mention % | Share of tracked AI answers in which the brand appeared at all |
| Share of Voice % | Brand's mentions as a share of all brand mentions in the category |
| GEO Quality % | How favorably and forcefully AI talks about the brand when it appears |
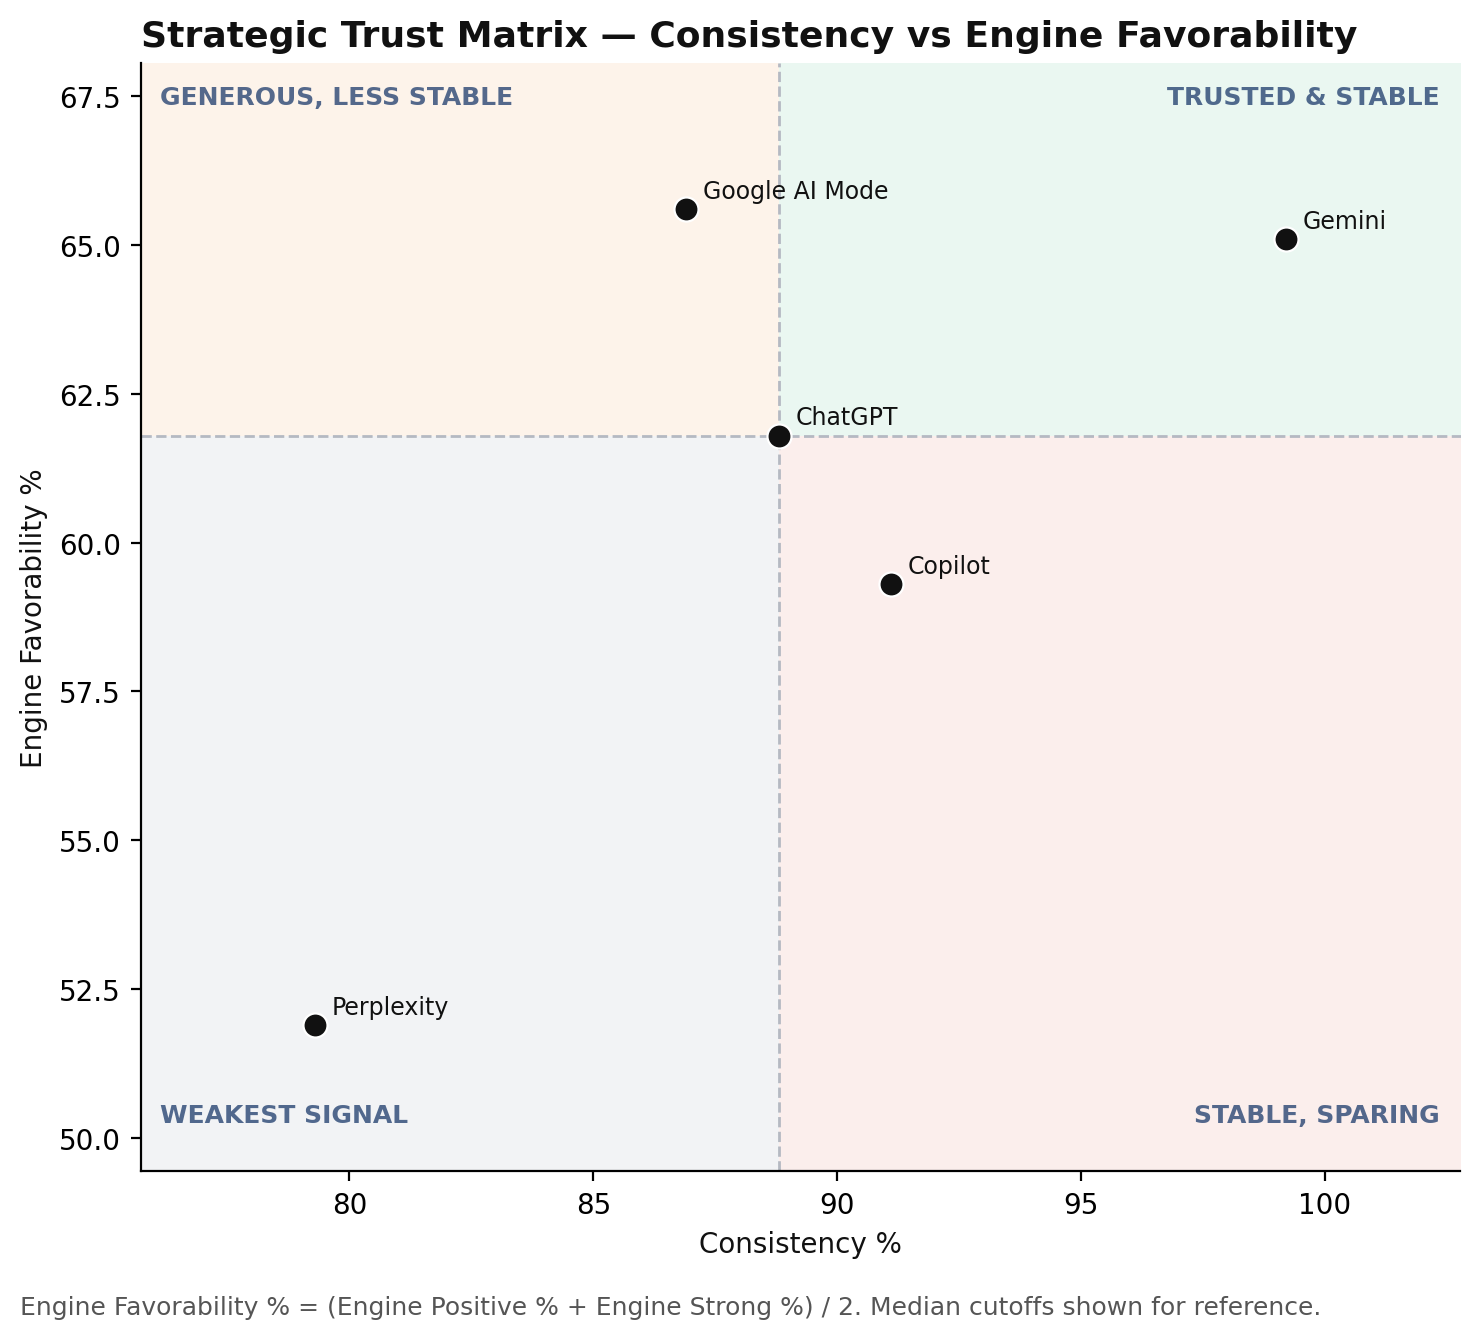
| Engine Favorability % | Same formula as GEO Quality %, measured at the AI-engine level |
| Consistency % | How reliably a brand or engine shows up the same way, run after run |





| Journey / Intent | Winning Brand | Quality % |
|---|---|---|
| Awareness | TVS Motors | 42.3% |
| Consideration | TVS Motors | 61.2% |
| Decision | TVS Motors | 78.3% |
| Informational Intent | TVS Motors | 45.7% |
| Commercial Intent | TVS Motors | 73.0% |
| Cluster | Winning Brand | Mention Share % | Quality % |
|---|---|---|---|
| Popularity & Best-Selling | Honda | 27.1% | 83.8% |
| Mileage & Running Costs | Hero | 26.8% | 72.5% |
| Budget & Affordability | Hero | 25.7% | 71.8% |
| Women & Ease of Use | TVS Motors | 23.2% | 75.7% |
| Scooter & Moped Segment | TVS Motors | 22.5% | 75.0% |
| Performance & Engine Type | Bajaj | 18.9% | 74.2% |
| Electric & Upcoming | Ather | 11.5% | 41.6% |


| Engine | Avg Citations / Prompt | Citation Share % | Third-Party Dependency % |
|---|---|---|---|
| ChatGPT | 15.8 | 37.9% | 86.4% |
| Perplexity | 10.0 | 23.9% | 97.7% |
| Google AI Mode | 8.5 | 20.5% | 84.5% |
| Copilot | 3.9 | 9.3% | 94.8% |
| Gemini | 3.5 | 8.3% | 81.8% |

AI has already picked its visibility leaders in Motorcycles & Scooters, but not its trust leaders.
The top 5 brands command 70.7% of Share of Voice, while the strongest AI endorsement in the category goes to Revolt, a brand with barely 1.6% mention share, and to niche specialists like River and Gogoro that most reach-based rankings would miss entirely.Incumbents own reach in this category, but a low-visibility specialist owns AI's favorability, and that gap is where a GEO strategy earns its keep.
→ What would it take to convert Revolt's quality signal into reach, or TVS Motors' reach into matching quality?
Reach without proportional quality leaves real room for challengers with sharper AI positioning to close the gap on trust even without matching TVS Motors on volume.
→ Is TVS Motors' AI presence winning consideration, or just occupying it?
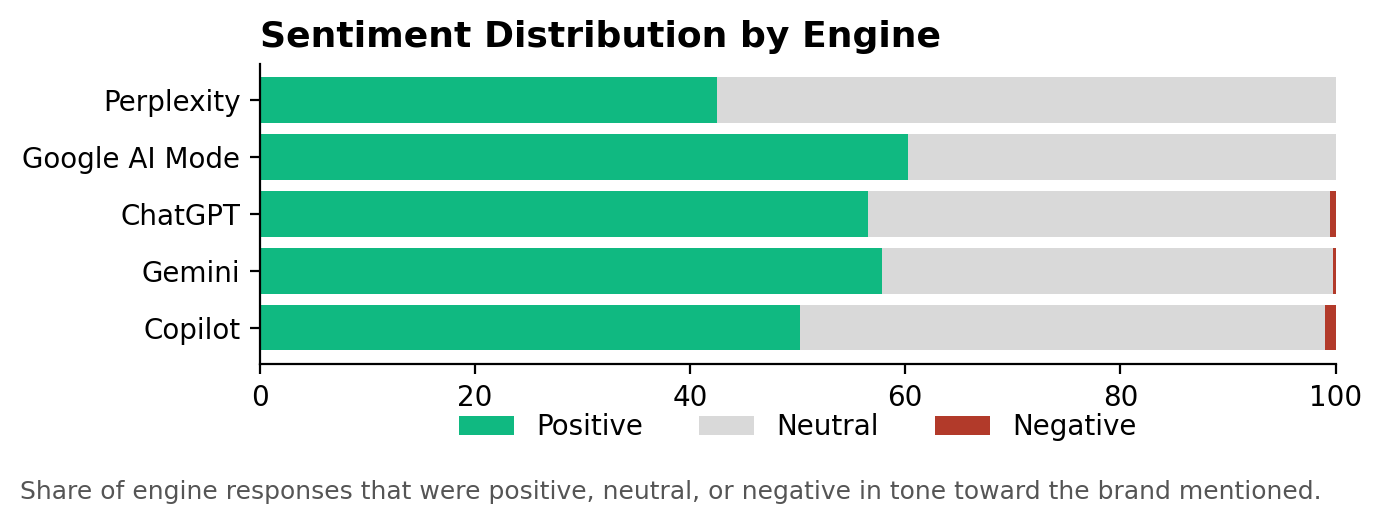
A brand optimizing purely for Copilot volume may be missing the more generous framing available elsewhere in the AI engine mix.
→ Which engine's audience matters more: the one that mentions a brand most, or the one that recommends it best?
Even the most visible brand's AI presence here is entirely borrowed, not earned from its own domain.
→ What would it take to get a brand's own site cited directly, rather than routed through a third-party aggregator or review site?
Electric two-wheeler brands are being compared against each other, not against combustion-engine incumbents, but AI's tone toward the category as a whole is still more measured than it is for established petrol brands.
→ Is that caution a content gap EV brands can close, or a reflection of a genuinely earlier-stage AI information ecosystem?
| Brand Posture | Strategic Label | Question to Ask |
|---|---|---|
| High reach, high quality | Leaders | How do we defend both dimensions as competitors close the gap? |
| Low reach, high quality | Niche Quality | What is the fastest, lowest-cost way to convert trust into reach? |
| High reach, low quality | High Noise | Is our AI presence building consideration, or just occupying it? |
| Low reach, low quality | Laggards | Is this category worth an active GEO investment right now? |
TVS Motors leads AI visibility in India's Motorcycles & Scooters category, with a 20.0% Share of Voice and a 48.2% Mention % across tracked AI engine responses.
Revolt leads GEO Quality at 77.4%, the highest of any brand meeting the minimum mention threshold, ahead of Hero (70.3%) and Ultraviolette (68.4%).
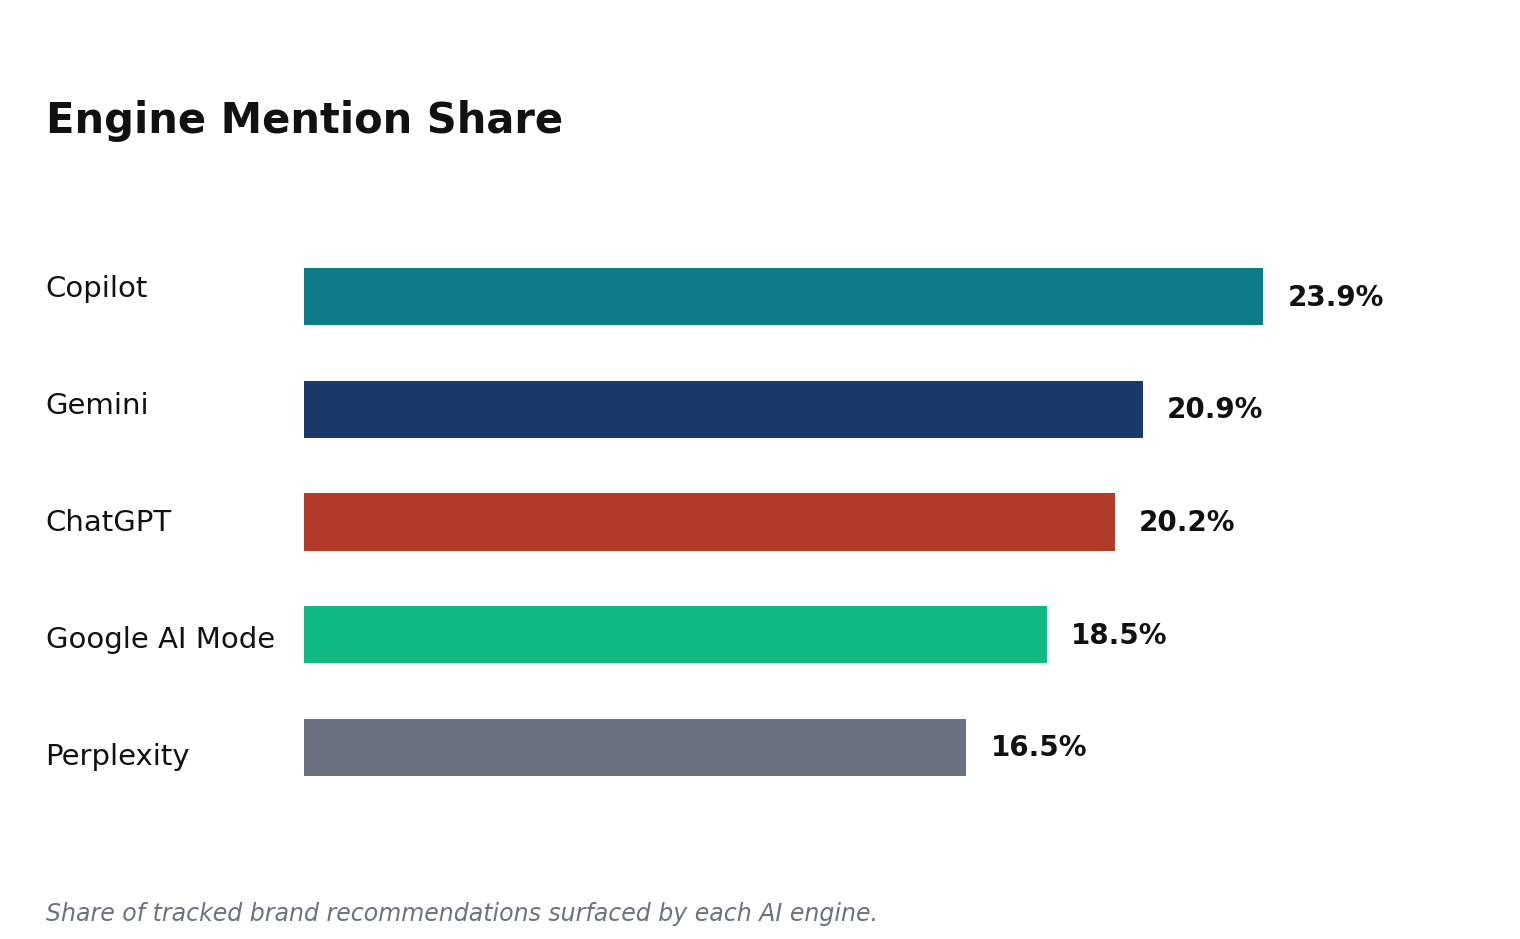
Copilot is the most frequently surfaced engine in this category, with a 23.9% mention share, ahead of Gemini (20.9%) and ChatGPT (20.2%).
The top 5 brands, TVS Motors, Honda, Hero, Bajaj and Suzuki, hold 70.7% of total Share of Voice, indicating a moderately concentrated market where AI has already formed clear favorites.
Business websites supply the largest share of citations at 34.3%, followed by e-commerce and aggregator platforms at 22.8% and news and media outlets at 15.6%.
TVS Motors, Honda, Hero, Bajaj, Ampere and Ather all post a perfect 100.0% Brand Consistency score among the top 10 tracked brands, indicating dependable, repeatable AI presence rather than one-off mentions.
The category-wide Owned Source Influence is just 4.8%, meaning 95.2% of AI-cited information about these brands comes from third-party sources rather than the brands' own websites.
The clearest opportunity sits with Hidden Gems brands like River, Gogoro and Kawasaki, which already earn strong GEO Quality (averaging 71.2%) on minimal Share of Voice, meaning the fastest lever for these brands is visibility, not credibility.
| Metric | Method |
|---|---|
| GEO Readiness Score | 30% Visibility + 25% Quality + 20% Consistency + 15% Citation Readiness + 10% Owned Source Influence |
| Mention % | Unique brand appearances / total prompt-engine-run units × 100 |
| Share of Voice % | Brand mentions / total brand mentions × 100 |
| GEO Quality % | (Positive % + Strong %) / 2 |
| Engine Favorability % | Same formula as GEO Quality %, applied at the AI-engine level. Measures tone/favorability, not engine accuracy or reliability. |
| GEO Quality Leader | Highest GEO Quality % among brands meeting the minimum mention threshold |
| AI Authority % | Weighted composite of normalized visibility, GEO Quality, engine presence and appearance strength; described as the closest composite measure of observed AI representation strength in this dataset |
| Brand Consistency % | 45% Run Appearance + 35% Consecutive Retention + 20% Rank Stability |
| Engine Consistency % | 40% Avg Retention + 25% Avg Jaccard + 20% Core Brand Rate + 15% Rank Stability |
| Citation Share % | Citations from source category / total citations × 100 |
| Owned Source Influence % | Brand own-domain citations / brand total citations × 100 (estimated via domain/brand-token matching) |
| Co-mention Association % | Responses where Brand A and Brand B appear together / responses where either appears × 100 |
| Opportunity / Readiness Quadrants | Median split on the two plotted axes, cutoffs specific to the brand pool plotted in each chart |
| Market Concentration % | Sum of Share of Voice % for the top 5 brands |
| Funnel Mention % | Brand mentions in a journey stage / all brand mentions in that journey stage × 100 |
Enter your name, email, and user type and we will send this report PDF to you.