
About the Passenger Cars AI Visibility & GEO Readiness Report
The Passenger Cars AI Visibility & GEO Readiness Report benchmarks how passenger car brands in India are discovered, mentioned, compared and recommended across leading AI search and answer engines. Findings are drawn from an analysis of 1.75 million AI answers collected over 7 days, in response to category-specific, use-case and intent-driven queries measuring AI visibility, share of voice, recommendation quality, consistency, citation authority and owned-source influence. This report is part of GoVISIBLE's AI Visibility Index India 2026.What Does This Report Measure?
This report reflects how AI engines respond to use-case and intent-driven prompts specific to passenger cars, such as "best 7-seater SUV under 15 lakh" or "most reliable family sedan in India," not generic brand-awareness or "top car brands" rankings. Because the prompt universe here is intent-driven rather than a generic "top brands" list, a brand's AI Readiness standing in this report can legitimately differ from how it would rank on a broad prompt like "top 10 automotive brands in India." That is a scope difference, not an error.Who Is This Report For?
This report is written for marketing leaders, managers and specialists, GEO and SEO teams, content and digital marketers, PR and communications professionals, and agencies who want to understand how their brand and competitors appear and get recommended across AI search and answer platforms. It is also relevant to performance, growth and product marketing roles, and to category-specific functions such as dealer network and fleet/B2B sales teams evaluating how their brand shows up in AI-driven car buying journeys.| Term | In one line |
|---|---|
| Mention % | Share of prompt-engine-run units the brand appeared in at all (reach) |
| Share of Voice % | Brand's mentions as a share of all brand mentions in the category |
| GEO Quality % | How favorably and forcefully AI talks about the brand when it appears |
| Engine Favorability % | Same formula as GEO Quality %, applied at the AI-engine level |
| Consistency % | How reliably a brand or engine shows up the same way, run after run |
How AI-Ready Is the Passenger Cars Market?
Passenger Cars scores 76.3% on GoVISIBLE's composite GEO Readiness Score, a blend of visibility, quality, consistency, citation readiness and owned-source influence. That places the category as reasonably AI-ready overall, but the headline number hides a real split: the brand AI surfaces most often is not the brand AI recommends most warmly.Which Passenger Cars Brands Lead AI Visibility and Recommendation Quality?
Tata Motors leads share of voice outright at 15.8%, roughly 1.5 points ahead of Hyundai at 14.3% and well clear of Maruti Suzuki at 12.7%. But the volume leader is not the quality leader. Subaru tops GEO Quality at 79.9%, more than 13 points ahead of Tata Motors' 66.7%, a gap that says AI's warmest endorsement in this category currently belongs to a low-volume specialist brand, not the brand it talks about most. Among brands with meaningful reach, the picture is tighter. Škoda posts the strongest quality score of any top-10 volume brand at 70.7%, ahead of Mahindra at 69.3% and Maruti Suzuki at 66.8%. Tata Motors and Toyota sit just behind at 66.7% and 66.1%. Hyundai, despite its strong reach, trails on quality at 62.0%, the widest reach-to-trust gap among the top five brands by share of voice.

Top Brand Winners
| Brand | Mention % | SOV % | Positive % | Strong % | GEO Quality % | AI Authority % |
|---|---|---|---|---|---|---|
| Tata Motors | 47.0 | 15.8 | 62.1 | 71.2 | 66.7 | 89.6 |
| Hyundai | 43.0 | 14.3 | 55.6 | 68.4 | 62.0 | 85.3 |
| Maruti Suzuki | 38.1 | 12.7 | 60.7 | 72.8 | 66.8 | 82.2 |
| Mahindra | 24.0 | 8.0 | 61.3 | 77.3 | 69.3 | 71.4 |
| Toyota | 19.8 | 6.6 | 59.2 | 73.0 | 66.1 | 67.4 |
| Kia | 19.2 | 6.3 | 59.2 | 70.8 | 65.0 | 66.4 |
| Honda | 18.4 | 6.1 | 59.2 | 68.2 | 63.7 | 65.7 |
| Škoda | 13.8 | 4.5 | 61.8 | 79.6 | 70.7 | 62.9 |
| MG Motors | 11.5 | 3.9 | 42.8 | 60.5 | 51.7 | 56.4 |
| Volkswagen | 11.0 | 3.6 | 54.5 | 74.0 | 64.3 | 59.3 |
Top 10 GEO Quality Leaders
| Brand | GEO Quality % | Positive % | Strong % | Mention % |
|---|---|---|---|---|
| Subaru | 79.9 | 75.6 | 84.1 | 3.3 |
| Porsche | 71.7 | 63.3 | 80.0 | 1.2 |
| Škoda | 70.7 | 61.8 | 79.6 | 13.8 |
| Jeep | 70.5 | 63.6 | 77.3 | 1.7 |
| Mahindra | 69.3 | 61.3 | 77.3 | 24.0 |
| Maruti Suzuki | 66.8 | 60.7 | 72.8 | 38.1 |
| Tata Motors | 66.7 | 62.1 | 71.2 | 47.0 |
| Toyota | 66.1 | 59.2 | 73.0 | 19.8 |
| Mazda | 65.2 | 66.7 | 63.6 | 1.3 |
| Kia | 65.0 | 59.2 | 70.8 | 19.2 |
AI Visibility vs Recommendation Quality: Where Do Brands Stand in Passenger Cars?
Plotting share of voice against GEO Quality among the ten highest-reach brands shows Tata Motors and Maruti Suzuki as the only brands combining real scale with above-median quality, placing them in the Leaders quadrant alongside Mahindra, Toyota, Kia, Škoda and Volkswagen. Hyundai is the clearest surprise: strong reach at 14.3% SOV, but quality of 62.0% pulls it into High Noise, the widest reach-to-trust gap among the volume leaders. MG Motors sits lowest on quality among plotted brands at 51.7%, landing in Laggards despite meaningful reach.
Full Brand List by Quadrant
- Leaders: Tata Motors, Maruti Suzuki, Mahindra, Toyota, Kia, Škoda, Volkswagen
- Niche Quality: Subaru, BYD, Jeep, Mazda, Porsche, Land Rover, Lexus, GMC
- High Noise: Hyundai, Honda, MG Motors, Renault, Nissan, BMW, Citroën, Audi
- Laggards: Mercedes-Benz, Ford, Chevrolet, Volvo, Tesla, Suzuki, Jaguar
How Concentrated Is AI Visibility in the Passenger Cars Market?
The top 5 Passenger Cars brands, Tata Motors, Hyundai, Maruti Suzuki, Mahindra and Toyota, together hold 57.3% of category Share of Voice, leaving 42.7% spread across the remaining tracked brands. That is a moderately concentrated market: incumbents have real weight, but more than four in ten mentions still go to brands outside the top five, leaving room for a well-positioned challenger to gain ground.
Which AI Engines Matter Most for Passenger Cars Brand Visibility?
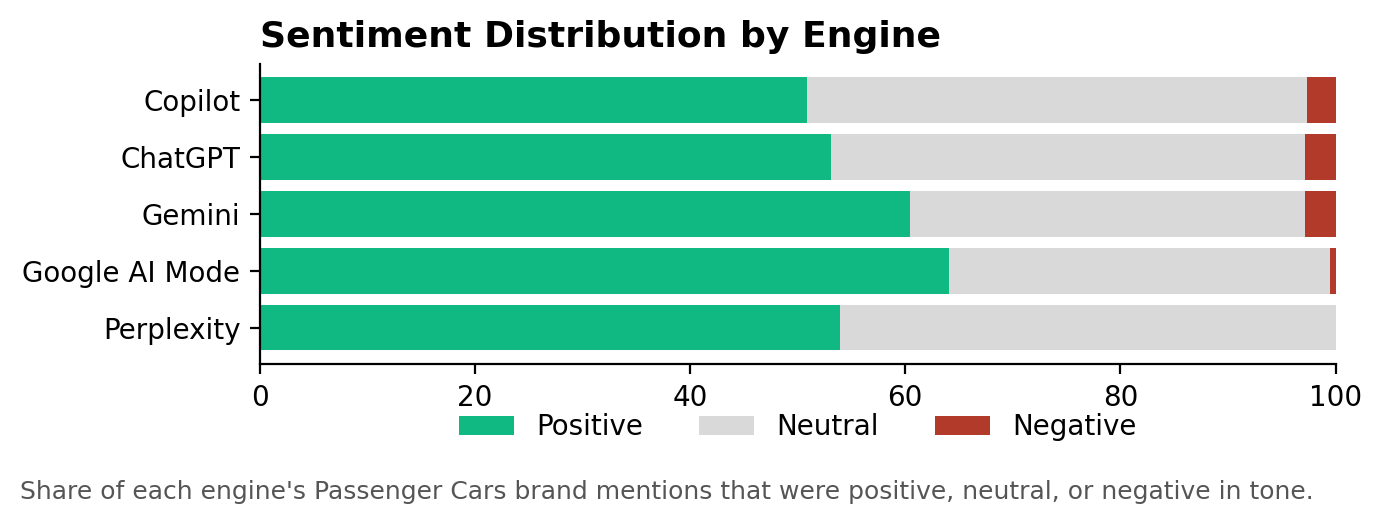
Copilot is surfaced most often in this category's tracked conversations, at 21.7% mention share, though ChatGPT (21.6%) and Gemini (21.6%) are effectively tied just behind it. Google AI Mode is the most generous engine by tone, with 64.1% of its brand mentions positive, ahead of Gemini at 60.4% and well ahead of Copilot at 50.9%, the engine that surfaces brands most often but talks about them the least warmly of the five.
| Engine | Share of Recommended Brands % | Positive % | Negative % | Strong % | Engine Favorability % |
|---|---|---|---|---|---|
| Copilot | 21.7 | 50.9 | 2.7 | 68.3 | 59.6 |
| ChatGPT | 21.6 | 53.1 | 2.8 | 65.4 | 59.2 |
| Gemini | 21.6 | 60.4 | 2.8 | 74.2 | 67.3 |
| Google AI Mode | 19.2 | 64.1 | 0.5 | 74.5 | 69.3 |
| Perplexity | 15.9 | 53.9 | 0.0 | 68.2 | 61.0 |
Which AI Engines Show the Most Consistent Brand Recommendations?
Gemini currently provides the most stable visibility signal in this dataset, at 99.4% consistency, with ChatGPT close behind at 99.3% and Google AI Mode at 98.8%. Copilot is the least stable at 89.1%, meaning a strong Copilot result today is less likely to repeat than a strong Gemini result, even though Copilot is the most frequently surfaced engine overall.

Which Brand Each Engine Currently Favors
| Engine | Rank | Brand | Engine Share % | Quality % |
|---|---|---|---|---|
| ChatGPT | 1st | Tata Motors | 14.6 | 53.1 |
| ChatGPT | 2nd | Hyundai | 13.9 | 52.8 |
| ChatGPT | 3rd | Maruti Suzuki | 13.1 | 62.6 |
| Copilot | 1st | Tata Motors | 16.8 | 72.4 |
| Copilot | 2nd | Hyundai | 14.8 | 57.2 |
| Copilot | 3rd | Maruti Suzuki | 13.3 | 60.3 |
| Gemini | 1st | Tata Motors | 14.0 | 72.2 |
| Gemini | 2nd | Hyundai | 12.5 | 69.1 |
| Gemini | 3rd | Maruti Suzuki | 11.1 | 72.6 |
| Google AI Mode | 1st | Tata Motors | 17.7 | 68.6 |
| Google AI Mode | 2nd | Hyundai | 14.0 | 73.7 |
| Google AI Mode | 3rd | Maruti Suzuki | 12.5 | 72.6 |
| Perplexity | 1st | Hyundai | 16.7 | 59.0 |
| Perplexity | 2nd | Tata Motors | 16.1 | 66.2 |
| Perplexity | 3rd | Maruti Suzuki | 13.6 | 68.0 |
How Consistent Are AI Brand Recommendations in Passenger Cars?
Hyundai, Maruti Suzuki, Škoda, Mahindra and Tata Motors all post a perfect 100.0% Brand Consistency score, meaning each shows up reliably run after run rather than as a one-off mention. Volkswagen and MG Motors follow closely at 99.1%. Every brand shown here carries Stable Leader status, so the distinction in this category is not between stable and volatile brands, but in how tightly a brand's rank holds from run to run.
Which Brands Win Across Different Buyer Intents and Journeys?
Tata Motors owns Awareness and Consideration, the two earliest stages of the buying journey, but Hyundai takes over at Decision. That pattern suggests Tata Motors' AI presence is strong at informing a shopper's early research, while Hyundai's AI representation carries more weight once a shopper is closer to choosing.
Journey Winners
| Journey | Brand | Quality % |
|---|---|---|
| Consideration | Tata Motors | 72.1 |
| Awareness | Tata Motors | 34.4 |
| Decision | Hyundai | 71.9 |
Intent Winners
| Intent | Brand | Quality % |
|---|---|---|
| Commercial | Tata Motors | 74.1 |
| Informational | Tata Motors | 54.1 |
Persona / Cluster Winners
| Cluster | Brand | Mention Share % | Positive % | Strong % | Quality % |
|---|---|---|---|---|---|
| Electric & Future Powertrains | Tata Motors | 28.5 | 50.2 | 63.2 | 56.7 |
| Petrol, Diesel, CNG & Hybrid | Tata Motors | 26.3 | 60.6 | 69.7 | 65.2 |
| Safety & Build Quality | Tata Motors | 22.4 | 81.6 | 88.8 | 85.2 |
| Body Type & Segment | Hyundai | 19.7 | 66.0 | 76.1 | 71.1 |
| Budget & Price Discovery | Hyundai | 17.2 | 68.4 | 76.8 | 72.6 |
| Market Trends & Resale | Maruti Suzuki | 16.4 | 76.8 | 83.2 | 80.0 |
| Performance & Driving Feel | Hyundai | 14.6 | 69.9 | 76.3 | 73.1 |
Where Is the Biggest AI Visibility Opportunity in Passenger Cars?
Porsche already earns AI's trust at 71.7% quality without spending on reach (just 0.4% SOV), alongside Land Rover (69.0%) and Mazda (65.2%) in the Hidden Gems quadrant. For these brands, the fastest lever is visibility, not credibility.
Which Sources Do AI Engines Trust When Recommending Passenger Cars Brands?
Who Does AI Trust? Business websites supply the largest share of what AI cites when discussing passenger car brands, at 28.6% of all citations, led by spinny.com, gomechanic.in and garwarehitechfilms.com. eCommerce and aggregator sites follow closely at 24.8%, dominated by cars24.com, cardekho.com and carwale.com, and news and media sources contribute 21.8%, led by autocarindia.com.
How Dependent Is Passenger Cars on Third-Party Sources for AI Visibility?
AI discovery in Passenger Cars is 97.0% dependent on third-party sources, with just 3.0% of citations tracing back to brand-owned domains category-wide. Mahindra leads on owned-source influence at 5.5%, followed by Škoda (5.1%) and Hyundai (5.0%). Tata Motors, despite leading the category on reach and authority, has the thinnest owned-source footprint of any major brand at just 0.4%.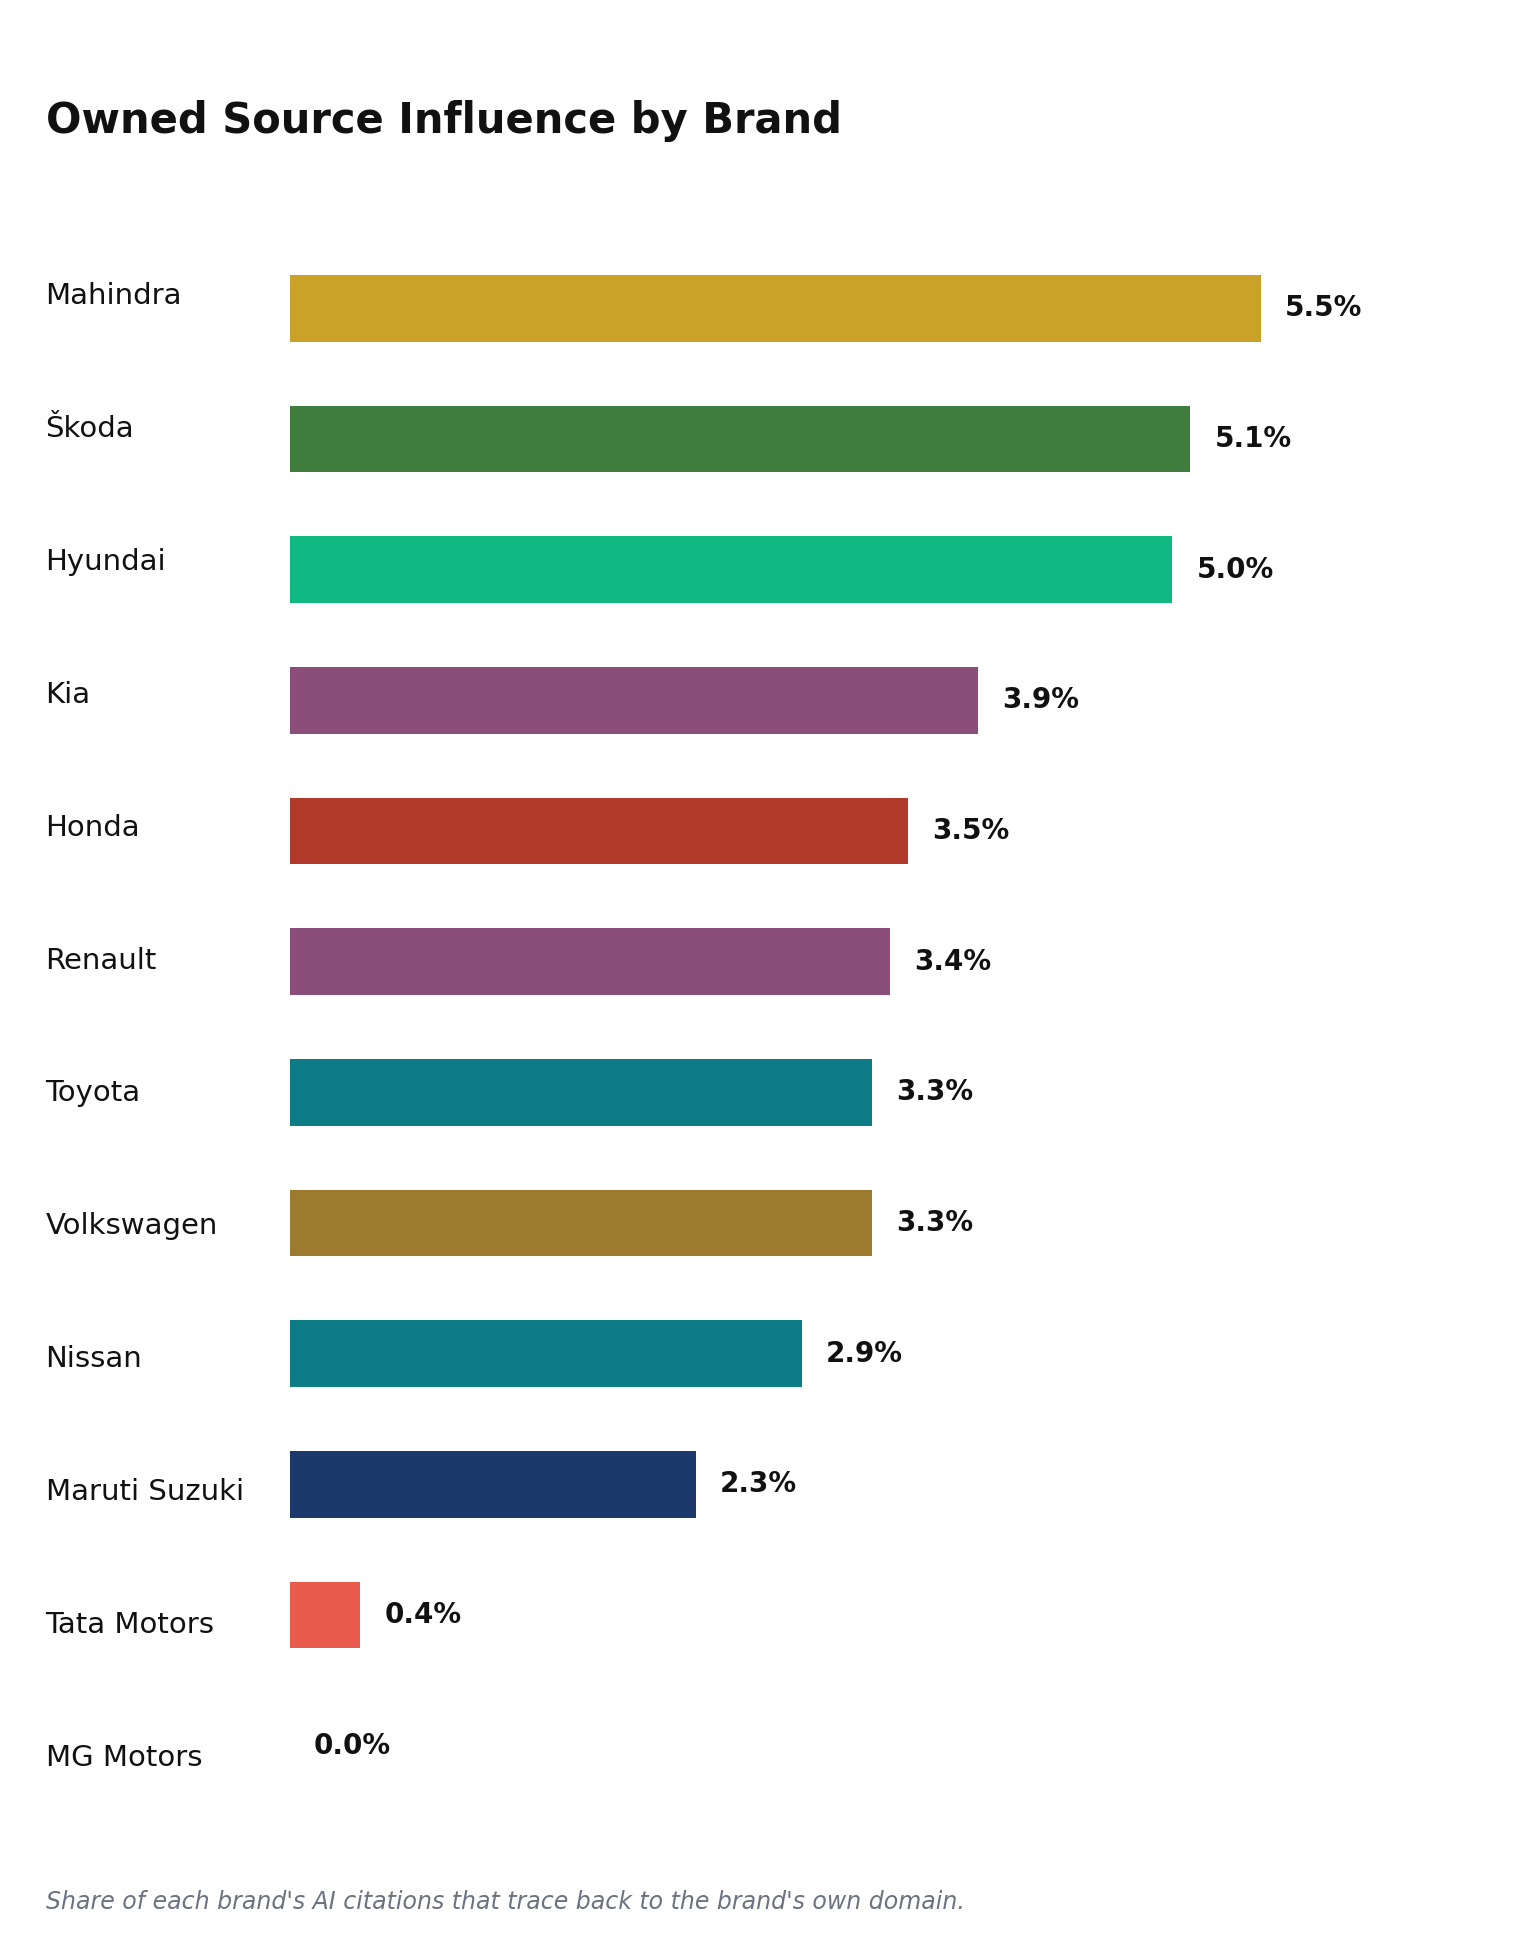
| Engine | Avg Citations / Prompt | Citation Share % | Third-Party Dependency % |
|---|---|---|---|
| ChatGPT | 17.1 | 38.2 | 87.3 |
| Copilot | 4.0 | 9.0 | 94.2 |
| Gemini | 4.2 | 9.4 | 88.1 |
| Google AI Mode | 9.4 | 21.1 | 92.7 |
| Perplexity | 10.0 | 22.3 | 99.0 |
What Should Passenger Cars Brands Do About Their AI Visibility?
Hyundai and Maruti Suzuki are the pair AI treats most as substitutes for one another, appearing together in 48.3% of responses that mention either, ahead of Tata Motors and Hyundai at 46.1% and Tata Motors and Maruti Suzuki at 45.3%.
AI hasn't decided who owns Passenger Cars yet.
The top 5 brands command 57.3% of visibility, while the category's strongest AI endorsement, Subaru at 79.9% GEO Quality, goes to a brand with only 3.3% mention share. Reach and trust are not the same game in this category yet.Executive Takeaways
The volume leader is not the trust leader.
Tata Motors leads Share of Voice at 15.8%, but Subaru's 79.9% GEO Quality is 13.2 points ahead of Tata Motors' 66.7%. Reach has not converted into the category's strongest AI endorsement.Brands leaning on mention volume alone are leaving the quality conversation to smaller, more specialized names.
→ Is your GEO content strategy optimizing for mention frequency, or for the tone AI uses once it mentions you?
The category is still winnable.
The top 5 brands hold just 57.3% of Share of Voice, leaving 42.7% distributed across the rest of the tracked set, and Hidden Gems like Porsche and Land Rover already carry above-70% quality scores on minimal reach.A challenger brand does not need to out-market the incumbents, it needs to convert existing AI trust into visibility.
→ Which of your brand's quality strengths are still invisible to AI because reach hasn't caught up?
Third-party sources, not brand sites, control the AI narrative.
Owned-source influence sits at just 3.0% category-wide, and aggregator and review platforms like cars24.com, cardekho.com and team-bhp.com together outweigh brand-owned domains many times over in citation share.GEO investment aimed only at brand.com content is optimizing a small fraction of what AI actually reads.
→ Does your GEO plan include the third-party ecosystem AI actually cites, or only your own site?
Engine choice changes who wins.
Tata Motors tops every engine except Perplexity, where Hyundai edges ahead, and Google AI Mode is both the most favorable engine in tone (69.3%) and among the most consistent (98.8%), a combination Copilot does not match.A single "AI visibility" score can hide meaningful engine-by-engine differences in who actually wins.
→ Which engine's audience matters most for your buyers, and is your content built for that engine specifically?
Awareness and Decision are won by different brands.
Tata Motors owns Awareness and Consideration, but Hyundai takes Decision, with 71.9% quality at that stage. A brand that dominates early-funnel AI mentions is not guaranteed to close the sale.Journey-stage visibility should be measured and targeted separately, not treated as one undifferentiated "AI visibility" metric.
→ Is your content strategy built to win Awareness, Decision, or both?
What This Means
| Brand Posture | Strategic Label | Question to Ask |
|---|---|---|
| High reach, high quality | Leaders | How do we defend this position as challengers close the trust gap? |
| Low reach, high quality | Niche Quality | Where is the fastest, lowest-cost path to more AI visibility? |
| High reach, low quality | High Noise | What in our AI-cited content is undermining the tone of our mentions? |
| Low reach, low quality | Laggards | Is this category worth a dedicated GEO investment right now? |
Frequently Asked Questions About Passenger Cars AI Visibility
Which passenger car brand has the highest AI visibility in India?
Tata Motors leads AI visibility in India's Passenger Cars category, with a 15.8% Share of Voice and 47.0% Mention %, according to GoVISIBLE's AI Visibility Index India 2026.
Which passenger car brand does AI recommend most positively?
Subaru has the highest GEO Quality score among Passenger Cars brands, at 79.9%, meaning AI engines talk about it more favorably and forcefully than any other tracked brand, despite its comparatively low reach.
Which AI engine surfaces passenger car brands most often?
Copilot has the highest mention share among AI engines in Passenger Cars, at 21.7%, narrowly ahead of ChatGPT and Gemini, which are effectively tied at 21.6% each.
Which AI engine is most consistent when discussing passenger car brands?
Gemini shows the most stable visibility signal in this dataset, with 99.4% Engine Consistency, ahead of ChatGPT at 99.3% and Google AI Mode at 98.8%.
How fragmented is AI visibility in the Passenger Cars category in India?
The top 5 Passenger Cars brands hold 57.3% of Share of Voice, leaving 42.7% distributed across the rest of the tracked brands, a moderately concentrated market with real opportunity for challenger brands.
What sources do AI engines cite most when discussing passenger car brands?
Business websites are the largest citation source in Passenger Cars at 28.6% of all citations, followed by eCommerce and aggregator sites at 24.8% and news and media at 21.8%.
Which passenger car brands are most consistently recommended by AI over time?
Hyundai, Maruti Suzuki, Škoda, Mahindra and Tata Motors each post a 100.0% Brand Consistency score, meaning they appear reliably across repeated AI answer runs rather than as one-off mentions.
How dependent is the passenger car category on third-party sources for AI visibility?
Passenger Cars is 97.0% dependent on third-party sources for AI citations, with only 3.0% of citations tracing back to brand-owned domains category-wide.
Methodology: How the Passenger Cars AI Visibility Index Was Measured
This report is based on analysis of 1.75 million AI answers, collected over 7 days, in response to category-specific, use-case and intent-driven queries about passenger car brands in India, across ChatGPT, Gemini, Google AI Mode, Copilot and Perplexity.| Metric | Method |
|---|---|
| Mention % | Unique brand appearances across prompt-engine-run units / total prompt-engine-run units × 100 |
| Share of Voice % | Brand mentions / total brand mentions × 100 |
| GEO Quality % | (Positive % + Strong %) / 2 |
| Engine Favorability % | Same formula as GEO Quality %, applied at the AI-engine level. Measures tone/favorability, not engine accuracy or reliability. |
| GEO Quality Leader | Highest GEO Quality % among brands with at least the configured minimum mention threshold |
| AI Authority % | Weighted composite of normalized visibility, GEO Quality, engine presence and appearance strength |
| Brand Consistency % | 45% Run Appearance + 35% Consecutive Retention + 20% Rank Stability |
| Engine Consistency % | 40% Avg Retention + 25% Avg Jaccard + 20% Core Brand Rate + 15% Rank Stability |
| Citation Share % | Citations from source category / total citations × 100 |
| Owned Source Influence % | Brand own-domain citations / brand total citations × 100 (domain/brand-token matched estimate) |
| Co-mention Association % | Answers where Brand A and Brand B appear together / answers where either appears × 100 |
| Opportunity Segments | Median split using Share of Voice % and GEO Quality % |
| Market Concentration % | Sum of Share of Voice % for Top 5 brands |
About GoVISIBLE
GoVISIBLE is an AI Visibility Intelligence company focused on understanding how AI engines discover, evaluate and recommend brands. We study how brands appear across AI-generated answers, what sources influence those answers, and which signals shape AI recommendations. Our platform helps brands translate these emerging patterns into measurable visibility and optimization strategies. The AI Visibility Index — India 2026 is part of GoVISIBLE's ongoing research into the changing dynamics of AI-led discovery and brand visibility. GoVISIBLE — Optimizing Brands for the AI Search Era.Thank you for reading.
Staying visible in AI answers matters in Passenger Cars because AI is already shaping the earliest stages of the car-buying journey, from awareness through consideration, well before a shopper visits a dealership. Brands that don't actively manage their AI representation are leaving that first impression to third-party sources they don't control. Take the next step to strengthen your brand's visibility in AI answers.Free AI Visibility Audit
See exactly how your brand shows up across AI engines today.- Full AI mention & quality scan
- Competitor benchmark
- Actionable next steps
Hire a GEO Expert
Get hands-on help building your AI visibility strategy.- 1:1 strategy session
- Category-specific guidance
- Ongoing optimization support
Request a Demo
See the full AI Visibility Index platform in action.- Live platform walkthrough
- Custom category data
- Q&A with our team
Agency Partner Program
Bring GEO services to your clients with GoVISIBLE.- Partner enablement
- Co-branded reporting
- Revenue share model