
Higher Education AI Visibility & GEO Readiness Report India 2026
About the Higher Education AI Visibility & GEO Readiness Report
The Higher Education AI Visibility & GEO Readiness Report benchmarks how universities, colleges and institutes in India are discovered, mentioned, compared and recommended across leading AI search and answer engines: ChatGPT, Gemini, Google AI Mode, Copilot and Perplexity. Findings come from GoVISIBLE's AI Visibility Index India 2026, an analysis of 1.75 million AI answers collected over 7 days in response to category-specific, use-case and intent-driven queries. The report measures AI visibility, share of voice, recommendation quality, consistency, citation authority and owned-source influence.What Does This Report Measure?
Every finding reflects how AI engines respond to use-case and intent-driven prompts within Higher Education: questions about admissions and application steps, fees and financial aid, rankings and best colleges, course eligibility, student life, study abroad comparisons, and the differences between types of institution. It is not a ranking of general brand awareness or market share. A brand's standing here can therefore differ from how it would appear on a broad prompt such as "top universities in India." That reflects a different prompt universe, not an error.Who Is This Report For?
Marketing leaders, managers, specialists, agencies and business decision-makers who want to understand how their institution, category and competitors appear and get recommended across AI search and answer platforms. It is relevant to brand, SEO, GEO, content, digital, performance, growth, admissions marketing and PR teams.Glossary quick-reference
| Term | In one line |
|---|---|
| Mention % | Share of prompt-engine-run units in which the brand appeared at all (reach). |
| Share of Voice % | A brand's mentions as a share of all brand mentions in the category. |
| GEO Quality % | (Positive % + Strong %) / 2: how favorably and forcefully AI talks about a brand when it appears. |
| Engine Favorability % | The same formula applied to an AI engine: how generous its tone is once it recommends a brand. It does not measure engine accuracy. |
| Consistency % | How reliably a brand or engine shows up across repeated runs. |
How AI-Ready Is the Higher Education Market?
GoVISIBLE's AI Visibility Index India 2026 finds that Higher Education in India has an AI readiness score of 52.5%, just past the midpoint, with visibility spread across many institutions and very little of it earned through institutions' own websites. University of Delhi leads on AI reach with 8.9% Mention %, while IIT leads on Share of Voice at 6.4%.Which Higher Education Brands Lead AI Visibility and Recommendation Quality?
The brand AI reaches for most often is not the brand it speaks about most favorably, and Higher Education shows that gap clearly. University of Delhi has the widest reach at 8.9% Mention %, yet IIT holds the larger Share of Voice at 6.4% against Delhi's 5.5%, and the highest GEO Quality in the category belongs to Sir J.J. School of Art at 85.7%. That is a 51.1pp gap between the reach leader's quality (34.6%) and the quality leader's score.

Top brands by reach
| Brand | Mention % | SOV % | Positive % | Strong % | GEO Quality % | AI Authority % |
|---|---|---|---|---|---|---|
| University of Delhi | 8.9% | 5.5% | 14.7% | 54.4% | 34.6% | 78.7% |
| CHRIST University | 6.6% | 3.6% | 44.2% | 67.9% | 56.1% | 74.1% |
| Symbiosis, Pune | 6.2% | 3.6% | 40.4% | 76.6% | 58.5% | 73.1% |
| IIT | 5.4% | 6.4% | 45.8% | 67.6% | 56.7% | 69.8% |
| BITS Goa | 5.4% | 3.1% | 36.2% | 59.4% | 47.8% | 67.4% |
| NMIMS University | 5.1% | 2.9% | 52.0% | 78.0% | 65.0% | 70.2% |
| Amity Online | 4.9% | 2.7% | 34.0% | 63.8% | 48.9% | 65.8% |
| St. Xavier's College | 4.8% | 2.8% | 42.4% | 78.5% | 60.4% | 68.1% |
| Loyola Academy | 3.6% | 2.0% | 41.9% | 79.0% | 60.5% | 63.1% |
| Lovely Professional University | 3.4% | 1.8% | 28.4% | 61.1% | 44.7% | 58.7% |
Top 10 GEO Quality leaders
| Brand | GEO Quality % | Positive % | Strong % | Mention % |
|---|---|---|---|---|
| Sir J.J. School of Art | 85.7% | 77.1% | 94.3% | 1.2% |
| Shaheed Sukhdev College of Business Studies | 84.5% | 77.6% | 91.4% | 1.9% |
| Krea University | 78.4% | 67.6% | 89.2% | 1.2% |
| Madras Christian College | 76.2% | 66.7% | 85.7% | 1.5% |
| FLAME University | 72.6% | 61.9% | 83.3% | 1.4% |
| Jamia Millia Islamia | 69.4% | 59.7% | 79.0% | 2.3% |
| MSU Baroda | 66.1% | 59.3% | 72.9% | 2.1% |
| NMIMS University | 65.0% | 52.0% | 78.0% | 5.1% |
| Indira College of Commerce and Science | 63.0% | 50.7% | 75.4% | 2.5% |
| Ashoka University | 61.8% | 47.4% | 76.3% | 2.7% |
AI Visibility vs Recommendation Quality: Where Do Brands Stand in Higher Education?
Plotting reach against quality shows who has earned both and who is trading one for the other. Six brands sit in the Leaders quadrant: CHRIST University, Symbiosis Pune, IIT, NMIMS University, St. Xavier's College and Loyola Academy. The biggest surprise is University of Delhi, which has the widest reach in the category but lands in High Noise because its quality is so low.
| Quadrant | Brands | What it means |
|---|---|---|
| Leaders | CHRIST University, Symbiosis, Pune, IIT, NMIMS University, St. Xavier's College, Loyola Academy | Reach and trust together. These brands are surfaced often and described well. |
| Niche Quality | Ashoka University, Indira College of Commerce and Science, Jain University, Jamia Millia Islamia, MSU Baroda, Shaheed Sukhdev College of Business Studies, IP University, Madras Christian College | Well regarded when they appear, but AI surfaces them rarely. Visibility is the lever. |
| High Noise | University of Delhi, BITS Goa, Amity Online, Lovely Professional University, VIT Pune, SRM University, IIM, IMS BHU | Frequent mentions without matching endorsement. Reach is not converting into trust. |
| Laggards | NIT Trichy, Chandigarh University, Jawaharlal Nehru University, Central University of Kerala, Delhi Technological University, Lady Shri Ram College | Limited reach and weaker quality. The most work to do on both. |
How Concentrated Is AI Visibility in the Higher Education Market?
This is a fragmented market. The top five brands by Share of Voice (IIT, University of Delhi, CHRIST University, Symbiosis Pune and BITS Goa) together hold 22.2% of all brand mentions, so AI has not yet locked in a small set of favorites and a challenger has real room to gain ground.
Which AI Engines Matter Most for Higher Education Brand Visibility?
Gemini surfaces Higher Education brands most often, at 28.0% of recommended-brand share, but it is not the most generous engine. Its 46.0% Engine Favorability trails Copilot (53.1%) and Google AI Mode (53.0%). Mention volume tells a brand where it is seen; tone tells it how it is described, and the two engines that lead on one do not lead on the other.
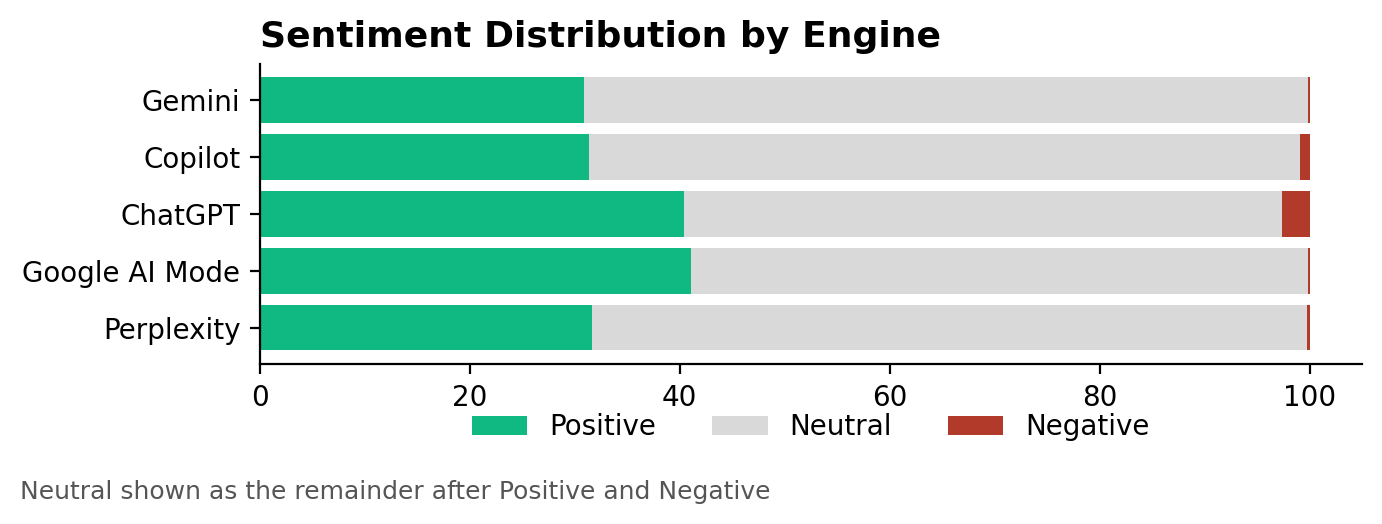
| Engine | Share of Recommended Brands % | Positive % | Negative % | Strong % | Engine Favorability % |
|---|---|---|---|---|---|
| Gemini | 28.0% | 30.9% | 0.1% | 61.1% | 46.0% |
| Copilot | 23.7% | 31.4% | 0.9% | 74.7% | 53.1% |
| ChatGPT | 18.9% | 40.4% | 2.6% | 58.1% | 49.2% |
| Google AI Mode | 18.6% | 41.1% | 0.1% | 65.0% | 53.0% |
| Perplexity | 10.7% | 31.7% | 0.2% | 53.1% | 42.4% |
Which AI Engines Show the Most Consistent Brand Recommendations?
Gemini currently provides the most stable visibility signal in this dataset, with Engine Consistency of 85.9%, while ChatGPT is the least repeatable at 60.6%. The practical meaning is that a brand's placement in Gemini answers is more likely to repeat from run to run than its placement in ChatGPT answers, where a win may not hold.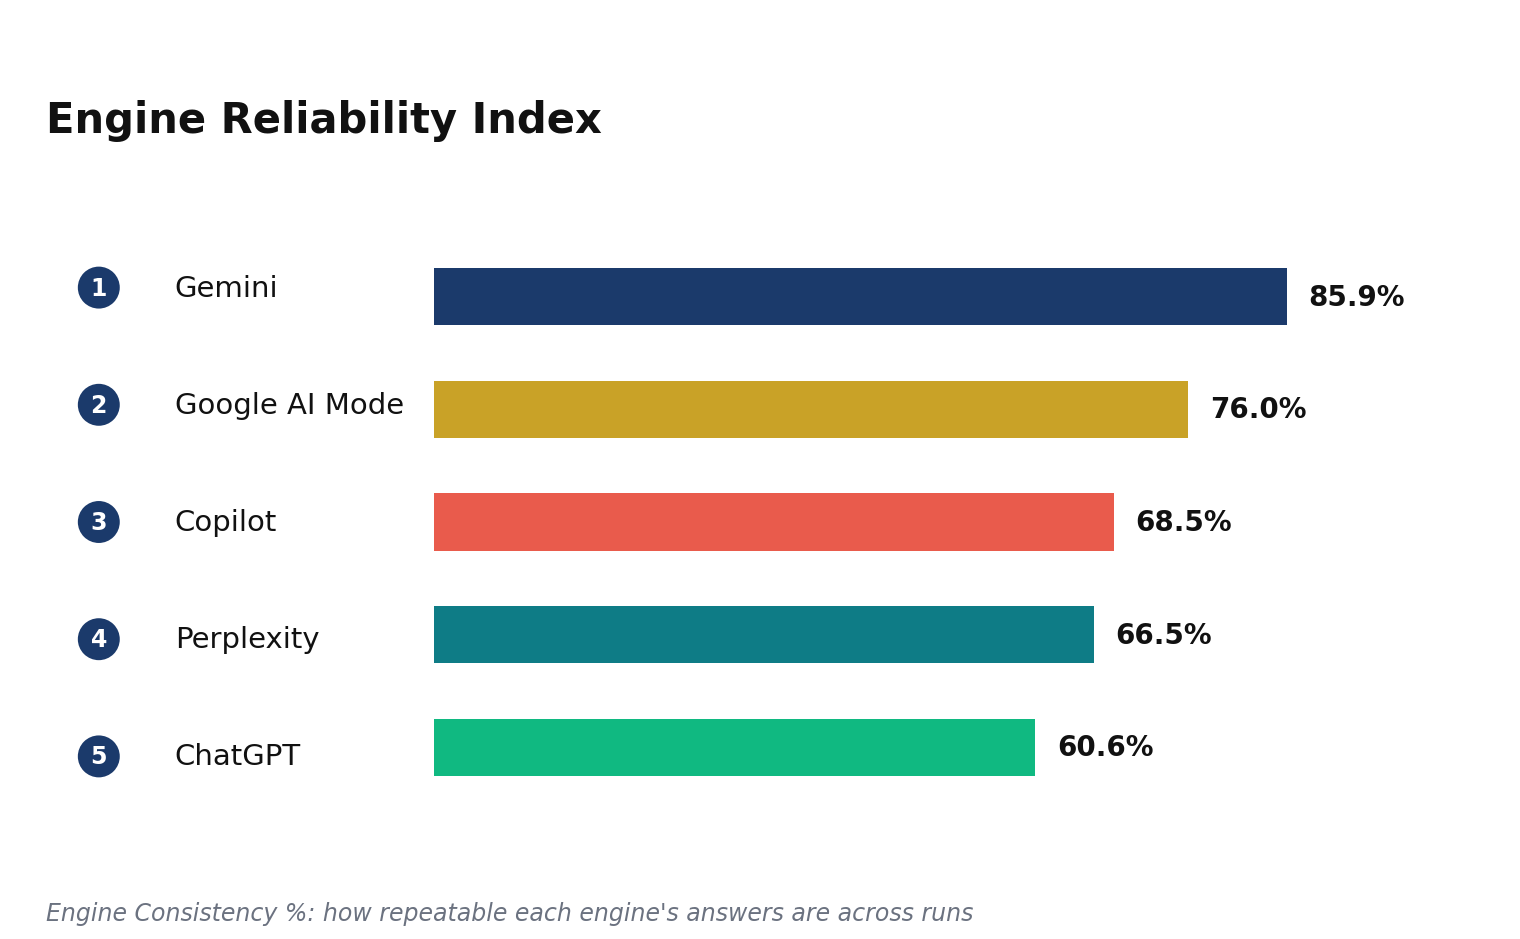

| Engine | Rank | Brand | Engine Share % | Quality % |
|---|---|---|---|---|
| ChatGPT | 1st | University of Delhi | 6.1% | 27.5% |
| ChatGPT | 2nd | IIT | 5.1% | 65.0% |
| ChatGPT | 3rd | CHRIST University | 4.0% | 56.2% |
| Copilot | 1st | IIT | 7.4% | 64.1% |
| Copilot | 2nd | University of Delhi | 4.8% | 44.2% |
| Copilot | 3rd | CHRIST University | 3.6% | 46.7% |
| Gemini | 1st | University of Delhi | 6.3% | 30.4% |
| Gemini | 2nd | IIT | 6.1% | 47.2% |
| Gemini | 3rd | IIM | 5.1% | 47.3% |
| Google AI Mode | 1st | IIT | 6.0% | 51.7% |
| Google AI Mode | 2nd | Symbiosis, Pune | 4.2% | 70.7% |
| Google AI Mode | 3rd | University of Delhi | 3.9% | 46.1% |
| Perplexity | 1st | IIT | 8.4% | 57.4% |
| Perplexity | 2nd | University of Delhi | 6.3% | 28.6% |
| Perplexity | 3rd | CHRIST University | 5.7% | 51.6% |
How Consistent Are AI Brand Recommendations in Higher Education?
Nine of the ten brands shown in the consistency table appear in every run, which makes them durable presences rather than one-off mentions. University of Delhi and IIT both score 100.0%, followed by CHRIST University at 99.0% and Symbiosis, Pune at 98.4%. The exception is Loyola Academy, which appeared in only half of runs and has a Brand Consistency of 42.5%.
| Brand | Run Appearance % | Consecutive Retention % | Rank Stability % | Brand Consistency % | Status |
|---|---|---|---|---|---|
| University of Delhi | 100.0% | 100.0% | 100.0% | 100.0% | Stable Leader |
| IIT | 100.0% | 100.0% | 100.0% | 100.0% | Stable Leader |
| CHRIST University | 100.0% | 100.0% | 95.2% | 99.0% | Stable Leader |
| Symbiosis, Pune | 100.0% | 100.0% | 92.1% | 98.4% | Stable Leader |
| St. Xavier's College | 100.0% | 100.0% | 90.8% | 98.2% | Stable Leader |
| NMIMS University | 100.0% | 100.0% | 85.6% | 97.1% | Stable Leader |
| BITS Goa | 100.0% | 100.0% | 85.6% | 97.1% | Stable Leader |
| Amity Online | 100.0% | 100.0% | 83.3% | 96.7% | Stable Leader |
| IIM | 100.0% | 100.0% | 78.7% | 95.7% | Stable Leader |
| Loyola Academy | 50.0% | 0.0% | 100.0% | 42.5% | Volatile |
Which Brands Win Across Different Buyer Intents and Journeys?
University of Delhi owns Awareness but loses ground by Decision to IIT, which suggests Delhi's AI presence informs without closing. IIT wins both Consideration and Decision, and at the Decision stage its quality reaches 90.0%, the highest figure in the journey and intent tables.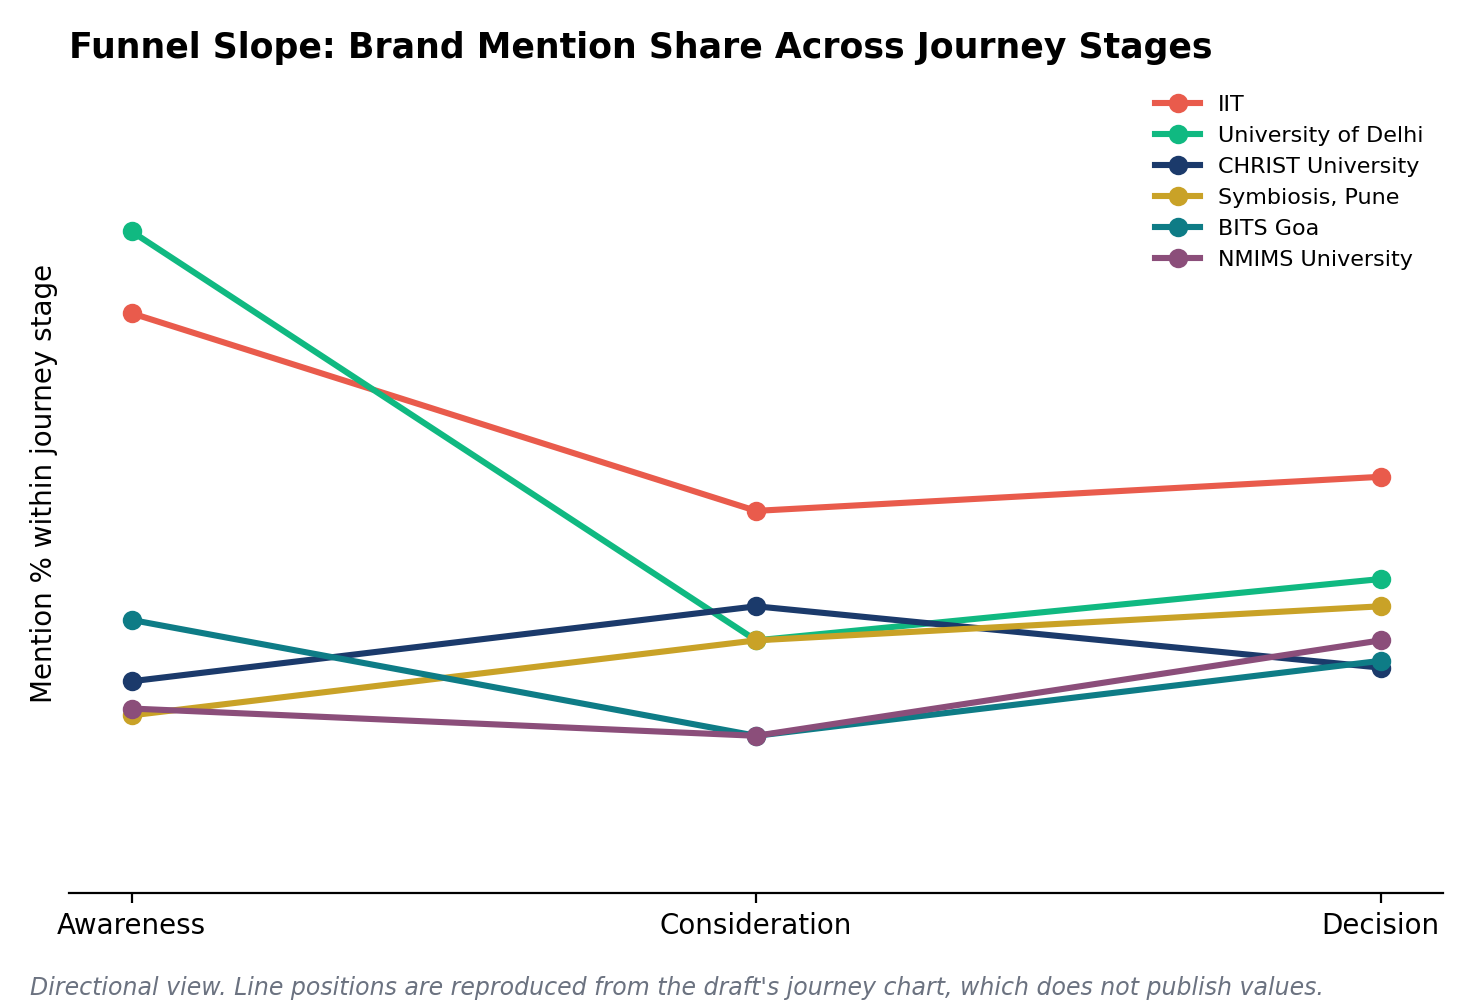
Journey winners
| Journey | Brand | Quality % |
|---|---|---|
| Awareness | University of Delhi | 28.3% |
| Consideration | IIT | 47.2% |
| Decision | IIT | 90.0% |
Intent winners
| Intent | Brand | Quality % |
|---|---|---|
| Informational | IIT | 36.1% |
| Commercial | IIT | 74.3% |
Persona and cluster winners
| Cluster | Brand | Mention Share % | Positive % | Strong % | Quality % |
|---|---|---|---|---|---|
| Student Life & Support | IIT | 44.2% | 53.3% | 69.0% | 61.2% |
| Study Abroad & Comparisons | IIT | 15.6% | 38.7% | 83.9% | 61.3% |
| Admissions & Application Process | Central University of Kerala | 10.1% | 40.3% | 47.2% | 43.8% |
| Fees & Financial Aid | BITS Goa | 7.5% | 18.0% | 54.0% | 36.0% |
| Course & Eligibility Information | University of Delhi | 7.0% | 4.0% | 53.3% | 28.7% |
| College Types & Institutional Differences | Indira College of Commerce and Science | 7.0% | 68.6% | 82.9% | 75.7% |
| Rankings & Best Colleges | NMIMS University | 4.8% | 69.9% | 87.7% | 78.8% |
Where Is the Biggest AI Visibility Opportunity in Higher Education?
The clearest opening for a challenger is the Hidden Gems group. Shaheed Sukhdev College of Business Studies (84.5% GEO Quality, 1.1% SOV), Jamia Millia Islamia (69.4%, 1.2%) and MSU Baroda (66.1%, 1.1%) already earn strong AI endorsement without much reach, so for them the fastest lever is visibility, not credibility.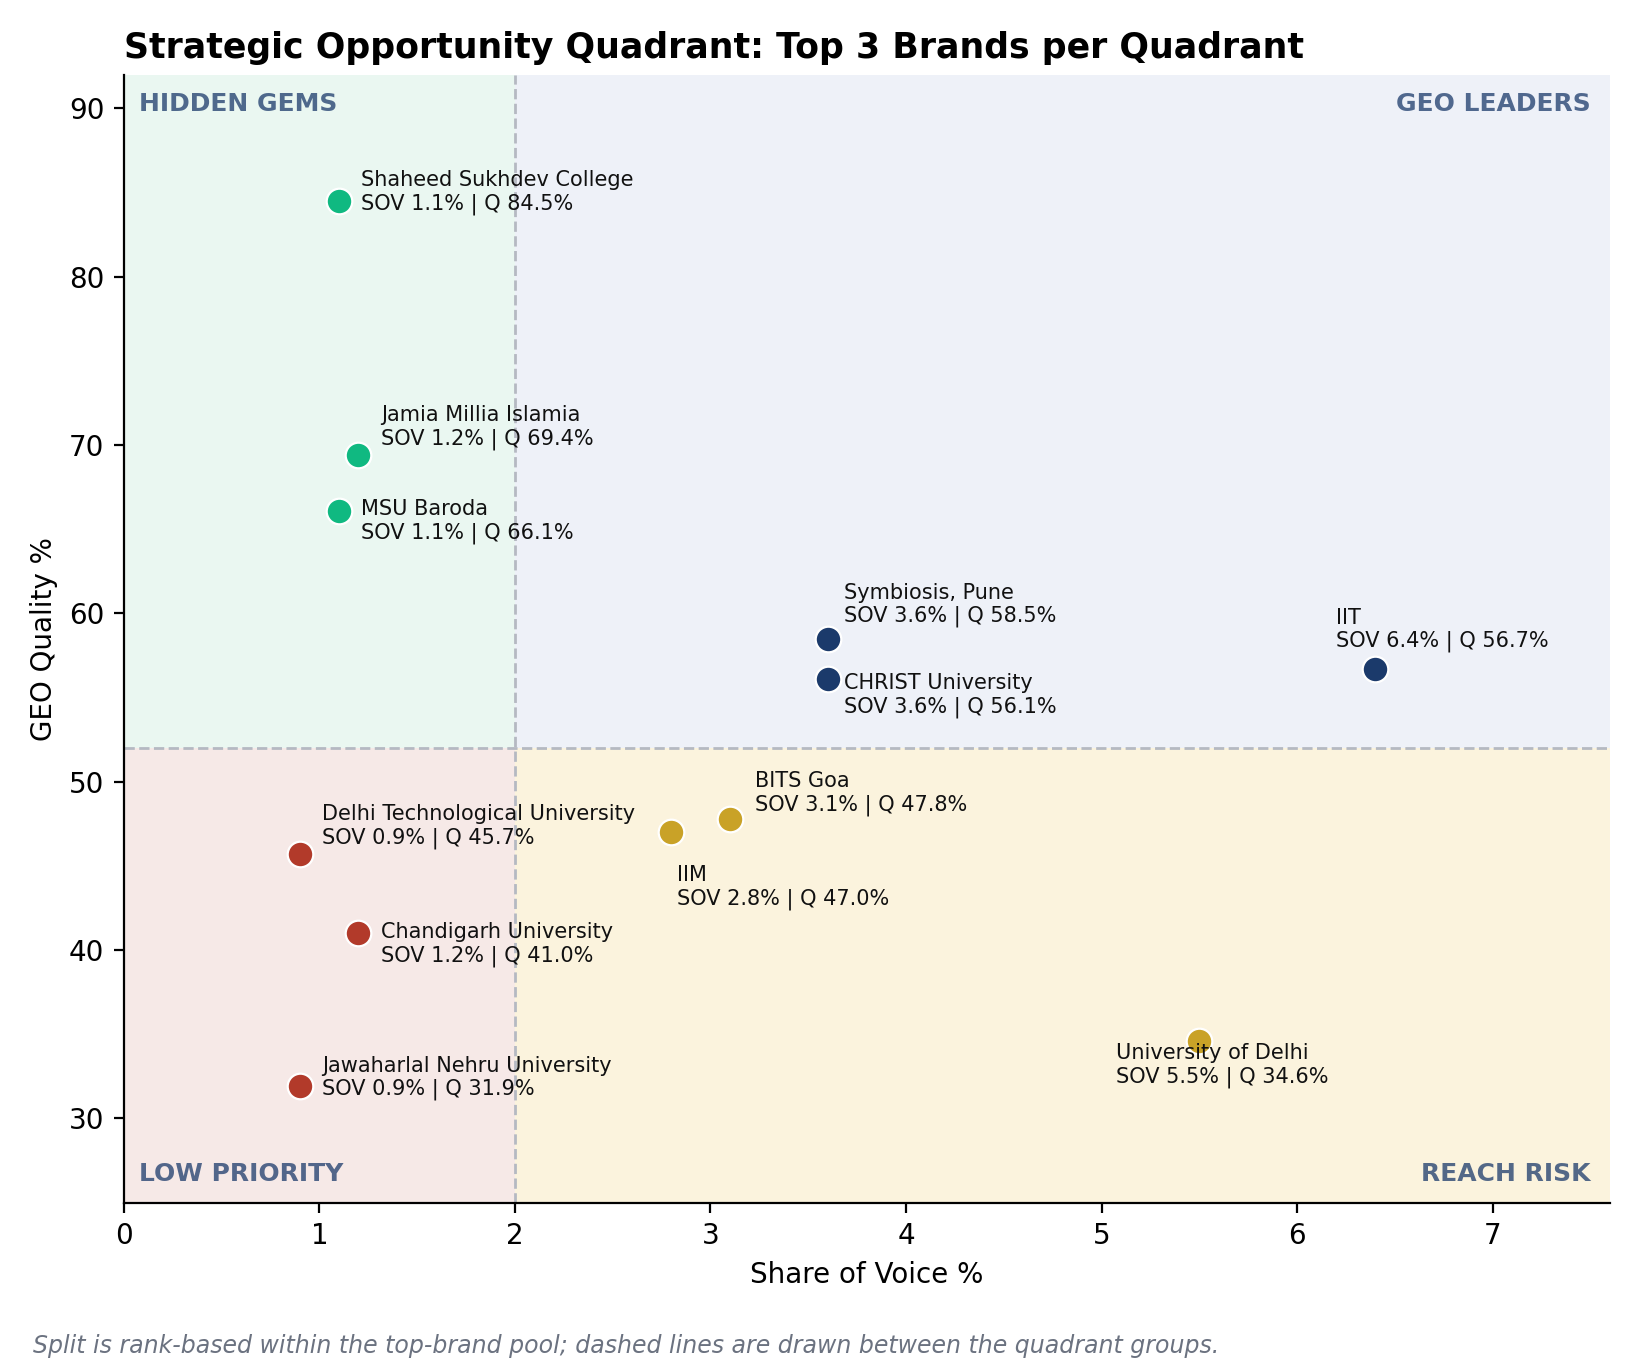
This view uses a different brand pool and a different x-axis than the Brand Readiness Quadrant in Section 3 (a top-brand pool split by Share of Voice rank and GEO Quality rank, rather than the draft's full tracked set plotted on Mention %), so quadrant cutoffs differ. A brand's values are consistent across both views, but its quadrant label may not be. For example, University of Delhi is High Noise in Section 3 and Reach Risk here.
Hidden Gems show the strongest trust signal, averaging 68.8% GEO Quality across the segment, while Reach Risk controls the highest visibility share within the top-brand pool at 25.4%. GEO Leaders in this view are Symbiosis Pune, IIT and CHRIST University. The Low Priority group includes Delhi Technological University, Chandigarh University and Jawaharlal Nehru University, and the Reach Risk group includes IIM, BITS Goa and University of Delhi.Which Sources Do AI Engines Trust When Recommending Higher Education Brands?
Your institution's own website is only one part of how AI describes it. Business websites supply 43.8% of citations in this category and review and comparison platforms another 21.7%, so roughly two-thirds of what AI cites comes from commercial and comparison sites outside any single institution's control.
| Source category | Share of citations | Top domains within category |
|---|---|---|
| Business Websites | 43.8% | kollegeapply.com (2%), collegesimplified.in (2%), goalisb.com (1%) |
| Review & Comparison Platforms | 21.7% | careers360.com (20%), reddit.com (16%), collegedunia.com (16%) |
| Government & NGO Sources | 10.3% | wikipedia.org (3%), teachers.institute (2%), bmu.edu.in (2%) |
| News & Media | 7.8% | indiatimes.com (29%), pw.live (9%), indianexpress.com (5%) |
| Blogs & Thought Leadership Platforms | 5.6% | karangupta.com (9%), scribd.com (5%), mbacrystalball.com (4%) |
| Business Directories & Listings | 4.2% | shiksha.com (56%), justdial.com (10%), findmycollege.com (8%) |
| Social Media Platforms | 2.4% | linkedin.com (39%), instagram.com (34%), facebook.com (13%) |
| Video & Streaming Platforms | 2.3% | youtube.com (99%), instagram.com (1%), gist.ly (0%) |
| eCommerce & Aggregator Sites | 1.9% | magicbricks.com (14%), studenthousing.co.in (8%), freejobalert.com (7%) |
How Dependent Is Higher Education on Third-Party Sources for AI Visibility?
AI discovery in Higher Education is 98.8% dependent on third-party sources, against an average Owned Source Influence of 1.2%, so institutions investing in the AI-citability of their own sites have real headroom. IIT is the clear exception at 8.6% owned influence, nearly four times the next-highest brand (IIM at 2.3%).
Engine citation load
| Engine | Avg Citations / Prompt | Citation Share % | Third-Party Dependency % |
|---|---|---|---|
| ChatGPT | 14.2 | 34.6% | 97.9% |
| Copilot | 4.0 | 9.8% | 99.3% |
| Gemini | 3.5 | 8.5% | 96.0% |
| Google AI Mode | 9.2 | 22.5% | 98.3% |
| Perplexity | 10.0 | 24.5% | 99.3% |
Brand website influence
| Brand | Owned Source Influence % | Third-Party Dependency % |
|---|---|---|
| IIT | 8.6% | 91.4% |
| University of Delhi | 1.0% | 99.0% |
| CHRIST University | 2.2% | 97.8% |
| Symbiosis, Pune | 0.0% | 100.0% |
| BITS Goa | 0.1% | 99.9% |
| NMIMS University | 0.0% | 100.0% |
| IIM | 2.3% | 97.7% |
| St. Xavier's College | 1.5% | 98.5% |
| Amity Online | 1.4% | 98.6% |
| Loyola Academy | 0.3% | 99.7% |
| VIT Pune | 0.0% | 100.0% |
| Lovely Professional University | 0.6% | 99.4% |
What Should Higher Education Brands Do About Their AI Visibility?
AI also treats some institutions as substitutes for one another. Symbiosis, Pune and NMIMS University are co-mentioned in 56.4% of the answers in which either appears, the strongest pairing in the matrix, followed by NMIMS and CHRIST University at 46.5% and Symbiosis and CHRIST at 44.1%. IIT behaves differently: its only meaningful pairing is with BITS Goa (34.8%), and it appears alongside the other leaders in 7.5% of answers or fewer, which places it in a separate competitive set.
AI hasn't decided who owns Higher Education in India, and the most visible names are not the most endorsed.
The top five brands command just 22.2% of Share of Voice, while University of Delhi's 8.9% reach comes with a 34.6% GEO Quality score and the strongest endorsement goes to institutions with under 3% Mention %.
The category is still wide open.
The top five brands hold 22.2% of Share of Voice, leaving 77.8% spread across the rest of the field.
No incumbent has locked in AI's attention, so a focused challenger can still win a place in answers.
→ Which two or three prompt clusters could your institution own before the field consolidates?
Reach and endorsement are different games.
University of Delhi leads Mention % at 8.9% but scores 34.6% GEO Quality, 30.4pp behind NMIMS University (65.0%) and 51.1pp behind Sir J.J. School of Art (85.7%).
Visibility without a favorable tone is noise. Brands in High Noise need to fix how they are described, not only how often.
→ When AI mentions your brand, would a prospective student want to shortlist it?
IIT is the one brand turning visibility into decisions.
IIT leads Share of Voice at 6.4%, wins Consideration and Decision, and reaches 90.0% quality at the Decision stage, while University of Delhi leads only Awareness at 28.3% quality.
Presence at the top of the funnel informs students; presence at the bottom is what closes the shortlist.
→ Where in the journey does AI currently stop recommending you?
AI builds its picture of institutions from other people's websites.
Third-party sources supply 98.8% of citations, owned sites only 1.2%, and business websites plus review platforms account for 65.5% of what AI cites.
Institutional sites are a small part of the evidence AI reads, so presence on Careers360, Collegedunia, Shiksha and similar platforms carries real weight.
→ Which of the platforms AI cites most describe your institution accurately today?
Engines disagree, and the most stable one is not the most generous.
Gemini surfaces brands most often (28.0%) and is the most consistent (85.9%) but has 46.0% favorability, while ChatGPT is the least repeatable at 60.6%.
A strong result on one engine may not carry to another, so each engine needs its own read of where the brand stands.
→ Do you know which engine your target students are most likely to use?
Quality is concentrated in institutions AI rarely mentions.
Sir J.J. School of Art (85.7%), Shaheed Sukhdev College of Business Studies (84.5%) and Krea University (78.4%) all have under 2% Mention %.
These Hidden Gems already have the credibility. What they lack is visibility, which is the cheaper problem to solve.
→ Is your institution a Hidden Gem, and what would raise its reach without diluting its quality?
What this means
| If your brand is... | Strategic label | The question to ask |
|---|---|---|
| Visible and well described | Leaders | How do we hold this position as engines and prompts shift? |
| Visible but poorly described | High Noise | What is AI reading about us, and where does it come from? |
| Well described but rarely surfaced | Niche Quality | Which prompts and sources would put us in front of more students? |
| Neither visible nor well described | Laggards | Where do we start: presence, tone, or both? |
Frequently Asked Questions
Which Higher Education brand has the highest AI visibility in India?
Which Higher Education brand does AI recommend most positively?
Which AI engine surfaces Higher Education brands most often?
How fragmented is AI visibility in Higher Education in India?
What sources do AI engines cite when discussing Higher Education brands?
Which Higher Education brands are most consistently recommended by AI?
Which Higher Education brand wins at the decision stage in AI answers?
Methodology: How the Higher Education AI Visibility Index Was Measured
This report is based on GoVISIBLE's AI Visibility Index India 2026, an analysis of 1.75 million AI answers collected over 7 days across ChatGPT, Gemini, Google AI Mode, Copilot and Perplexity. Prompts are use-case and intent-driven and specific to Higher Education, so results can differ from broad brand-awareness prompts. Metrics describe observed AI answer behavior, not consumer preference, market share or sales. The formulas below are reproduced as stated in the source analysis.| Metric | Method |
|---|---|
| GEO Readiness Score | 30% Visibility + 25% Quality + 20% Consistency + 15% Citation Readiness + 10% Owned Source Influence |
| Mention % | Unique brand appearances across prompt-engine-run units / total prompt-engine-run units x 100 |
| Share of Voice % | Brand mentions / total brand mentions x 100 |
| GEO Quality % | (Positive % + Strong %) / 2 |
| GEO Quality Leader | Highest GEO Quality % among brands meeting the minimum mention threshold (30+ mentions) |
| Engine Favorability % | (Engine Positive % + Engine Strong %) / 2. Measures the favorability of an engine's tone once it recommends a brand, not the engine's accuracy or reliability. |
| AI Authority % | Weighted composite of normalized visibility, GEO Quality, engine presence and appearance strength |
| Brand Consistency % | 45% Run Appearance + 35% Consecutive Retention + 20% Rank Stability |
| Engine Consistency % | 40% Avg Retention + 25% Avg Jaccard + 20% Core Brand Rate + 15% Rank Stability |
| Citation Source Authority | Source category citations / total citations x 100 |
| Owned Source Influence % | Brand own-domain citations / brand total citations x 100. Brand-domain matching is estimated from citation domain/URL and brand token. |
| Third-Party Dependency % | Share of a brand's citations that come from sources other than its own domain |
| Co-mention Association % | Answers where Brand A and Brand B appear together / answers where either appears x 100 |
| Market Concentration % | Sum of Share of Voice % for the top 5 brands |
| Visibility Concentration | Gini-based concentration of visibility across tracked brands |
| Opportunity Segments | Section 9: top-brand pool rank split by Share of Voice rank and GEO Quality rank. Section 3: median split on Mention % and GEO Quality %. |
| Funnel Mention % | Brand mentions in a journey stage / all brand mentions in that journey stage x 100 |
About GoVISIBLE
GoVISIBLE is an AI Visibility Intelligence company focused on understanding how AI engines discover, evaluate and recommend brands. We study how brands appear across AI-generated answers, what sources influence those answers, and which signals shape AI recommendations. Our platform helps brands translate these emerging patterns into measurable visibility and optimization strategies. The AI Visibility Index India 2026 is part of GoVISIBLE's ongoing research into the changing dynamics of AI-led discovery and brand visibility. GoVISIBLE: Optimizing Brands for the AI Search Era.Thank you for reading.
When students and parents ask AI engines to shortlist institutions, explain admissions or compare fees, the institutions AI surfaces and describes favorably are the ones that enter the conversation. This report shows who that is in India today. Take the next step to strengthen your brand's visibility in AI answers.Free AI Visibility Audit
See where your institution appears in AI answers today.- Mention and share-of-voice snapshot
- Comparison against competitors
- Priority fixes for AI citability
Hire a GEO Expert
Turn these findings into a practical roadmap with specialists.- Content and citation strategy
- Owned-source optimization
- Engine-by-engine guidance
Request a Demo
See how GoVISIBLE tracks your brand across AI engines.- Visibility tracking
- Recommendation quality
- Competitor benchmarks
Agency Partner Program
Offer AI visibility services to your clients.- Add GEO to your service lineup
- Reporting built for client delivery
- Partner onboarding and support
GoVISIBLE: The Leader in AI Visibility. marketing@govisible.ai | govisible.ai | linkedin.com/company/govisible-ai